Announcement

Collapse
No announcement yet.

A very helpful indicator

Collapse
X
 
  • Filter
  • Time
  • Show
Clear All
new posts

  • A very helpful indicator

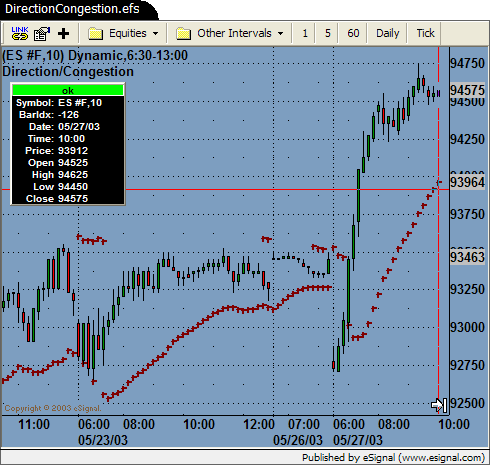
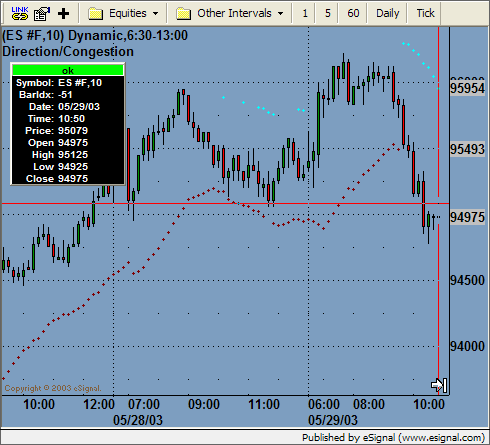
    I am attaching a document to describe an very useful indocator for determining direction and congestion in the market. I have attempted several times to write something in efs, but have not been successful.

    Any help would be greatly appreciated.

    Anyone can contact me by private message if they have questions.

    DaTr8dr
    Attached Files

  • #2
    Man,

    I just read my post and my typing/spelling sucks.

    LOL.

    DaTr8dr

    Comment


    • #3
      Hello DaTr8dr,

      Thank you for the formula suggestion. I've made an attempt to translate your formula to EFS. Please try the attached formula and let me know if it is correct.

      I noticed there was a couple of additional lines in the chart image you attached. Are those part of a different study? What about the coloring of the bars?

      Attached Files
      Jason K.
      Project Manager
      eSignal - an Interactive Data company

      EFS KnowledgeBase
      JavaScript for EFS Video Series
      EFS Beginner Tutorial Series
      EFS Glossary
      Custom EFS Development Policy

      New User Orientation

      Comment


      • #4
        Hi Jason,

        The paintbars are a part of another efs. I have the efs attached in a slightly different format, but it is basically the same as yours. I have modified the RSI triggers to 48 and 52 to catch a larger congestion period. Tell me what you think.

        Thanks for your response.

        DaTr8dr
        Attached Files

        Comment


        • #5
          Jason,

          One thing that I like about the efs that I am using is that the dots are more uniform with the trend and do not move in a jagged plot with the price bar.

          See attached screen shot.

          Thanks again.

          DaTr8dr
          Attached Files

          Comment


          • #6
            Hello DaTr8dr,

            The "jagged" effect just has to do with the size specified in preMain(). I changed it to 1 to match the size of your wizard formula. I've added some formula parameters that you can play with as well. Use the "Edit Studies" option to change the Price Source and Length for the RSI study. You can also change the value of LEN and the colors for the upper and lower dots.

            Attached Files
            Jason K.
            Project Manager
            eSignal - an Interactive Data company

            EFS KnowledgeBase
            JavaScript for EFS Video Series
            EFS Beginner Tutorial Series
            EFS Glossary
            Custom EFS Development Policy

            New User Orientation

            Comment


            • #7
              thanks a bunch.

              I added the "setComputeOnClose();" command in the premain and it smoothed out the slope of the dots.

              I will experiment with the variables, thanks .


              DaTr8dr

              Comment

              Working...
              X