 Tweet
Tweet
Hi Everybody, is there anybody that can translate this easylanguage ? I want to build it in EFS, but I have no idea about EasyLanguage.
If somebody can tell me the logic of what is going on below, I will happily code it and put it on here.
Thanks
Variables:
VQI(0),
SumVQI(0);
If TrueRange <> 0 and (High - Low) <> 0 Then
VQI = ((Close - Close[1]) / TrueRange + (Close - Open) / (High - Low)) * 0.5
Else
VQI=VQI[1];
VQI = AbsValue(VQI) * ((Close - Close[1] + (Close - Open)) * 0.5);
SumVQI = SumVQI + VQI;
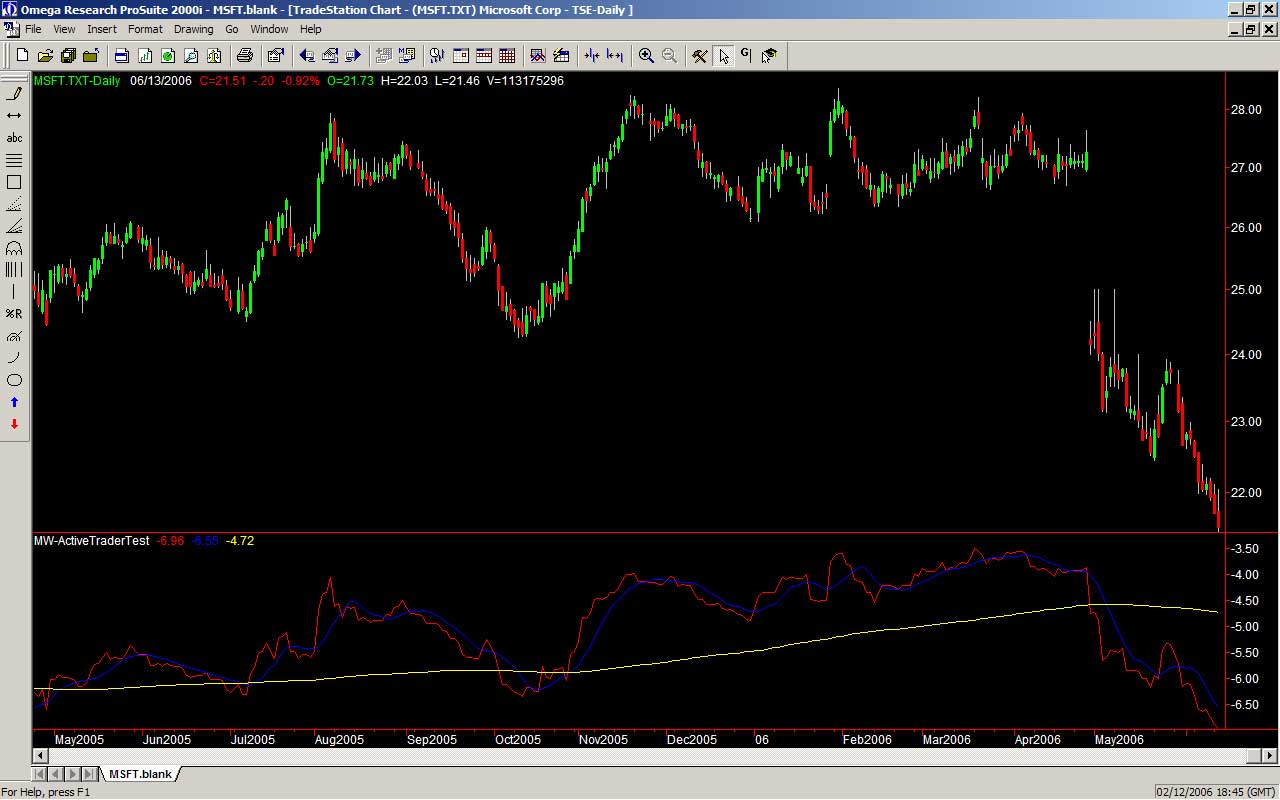
Plot1(SumVQI,"");
Plot2(Average(SumVQI,9),"");
Plot3(Average(SumVQI,200),"");
If somebody can tell me the logic of what is going on below, I will happily code it and put it on here.
Thanks
Variables:
VQI(0),
SumVQI(0);
If TrueRange <> 0 and (High - Low) <> 0 Then
VQI = ((Close - Close[1]) / TrueRange + (Close - Open) / (High - Low)) * 0.5
Else
VQI=VQI[1];
VQI = AbsValue(VQI) * ((Close - Close[1] + (Close - Open)) * 0.5);
SumVQI = SumVQI + VQI;
Plot1(SumVQI,"");
Plot2(Average(SumVQI,9),"");
Plot3(Average(SumVQI,200),"");

Comment