Announcement

Collapse
No announcement yet.

EFS for lower indicators only?

Collapse
X
 
  • Filter
  • Time
  • Show
Clear All
new posts

  • EFS for lower indicators only?

    Not sure which forum to post this...

    Are EFS studies for lower indicators only?

    1) Is there an existing EFS that would allow me to divide one equity by another? I'm looking to do this as an upper indicator and then apply various technical indicators below? For example, MXIM/SMH or IBM/SPY.

    2) If I only wanted to plot end-of-day closing prices, is an EFS study the way to go about it? How would one do this in eSignal?

    I'm trying to better understand what EFS studies can do for me.

    Thanks,
    Andy
  • #2
    Andy
    You don't necessarily need an efs to do the ratio you want.
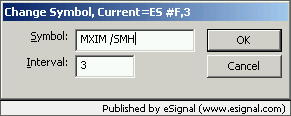
    Select an Advanced chart and type the following

    mxim /smh
    ibm /spy

    (please note the space before the divisor and non after)
    That should give a "close" line chart with the ratio.
    You can also apply a weighting if you so wish such as for example

    10mxim /0.3smh

    If instead you wanted to plot these ratios as an indicator you can use the attached efs.
    The default symbols in the efs are SPY /QQQ but you can use Edit Studies to insert any symbol you want.

    Alex
    Attached Files

    Comment


    • #3
      Andy,

      No need for EFS for either of these as they are built into eSignal.

      1) To pull up a chart on a spread, click on the Advanced Chart, type in the formula with a space prior to the operator (i.e. +-*/). There is an FAQ on the subject which can be found here.


      2) To plot only end-of-day closing prices I would suggest a daily line chart. To do this, click on an Advanced Chart, type ",D" (with no quotes) to pull up a daily chart, and then turn the chart to a line chart by selecting Chart Options --> Chart Type --> Line.
      Regards,
      Jay F.
      Product Manager
      _____________________________________
      Have a suggestion to improve our products?
      Click Support --> Request a Feature in eSignal 11

      Comment


      • #4
        Hi Andy,

        Not sure which forum to post this...
        I think you picked the right one.

        1) Is there an existing EFS that would allow me to divide one equity by another? I'm looking to do this as an upper indicator and then apply various technical indicators below? For example, MXIM/SMH or IBM/SPY.
        I believe that you can do this without an efs. For example you should be able to enter: MXIM /SMH and get a line chart of the results. Notice the format of the above is very important. You need a space between one Symbol and the next, but no space beltween the slash and the second Symbol.

        2) If I only wanted to plot end-of-day closing prices, is an EFS study the way to go about it? How would one do this in eSignal?
        I would just use a daily chart and use the close value. This is by far the simplist way.

        Garth
        Garth

        Comment


        • #5
          Wow...three answers all saying the same thing to the same question! Must be a first!

          Garth
          Garth

          Comment


          • #6
            Thanks for the quick reply. And as for 3 answers, I can definitely use the reinforcement. Thank you.

            Comment


            • #7
              Trendline madness

              Not sure if this is just me.

              When I plotted "QQQ /DIA", my trendline seems to go nuts. Yesterday, the 1st trendline drew find but when I copied the line, the 2nd went nonparallel to the 1st. Today my 1st trendline seems to go all over.

              I tried other tickers and did not seem to have any problems. Does this happen on other people's computers?

              Comment

              Working...
              X