*** General Information Requirements
1. - Study Title-Pro Go by Larry Williams
2. - I need a Non-price Study
3. - I need a Regular Study (Indicator)
4. - Detailed description -
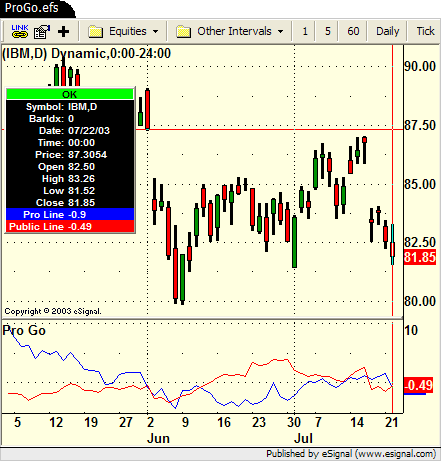
Pro Go is a 2 line graph using daily data.
1. Professional Line (color purple) is a professional Accumulation/Distribution line is constructed by using the change from today's open to today's close.
2. The Public Line (blue) is done by creating a public accumulation/distribution line that shows the change from yesterdays close to today's open.
The graph I see is an index of the previous close to open +/- values (public) and then taking a 14 day average which is plotted against a 14 day average of the +/- values of the open to close(pro)
I can fax the graphed example over if needed.
Questions? Phone is 952-368-3009. ask for Marty.
Email contact: [email protected]
Thanks!
Marty Traina

Comment