Announcement

Collapse
No announcement yet.

Drawing lines for 52 week hi/lo

Collapse
X
 
  • Filter
  • Time
  • Show
Clear All
new posts

  • Drawing lines for 52 week hi/lo

    Does anyone have the EFS that would automatically draw the 52 week hi and lo on a 1 or 5 min chart of a stock so that I can see the line and that important point rather than have to be aware of hi/lo's by looking at the quote or detail window?
    Thank you.

  • #2
    draeihle
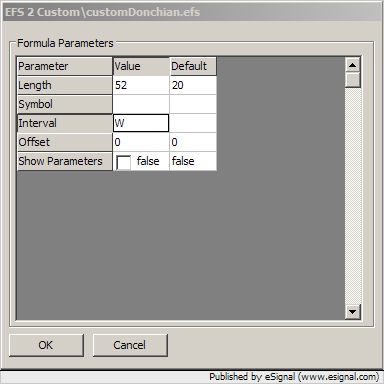
    To do that you can use the customDonchian efs which is provided in the EFS2 Custom folder in Formulas and set the Interval parameter to W (or w) and the Length parameter to 52.
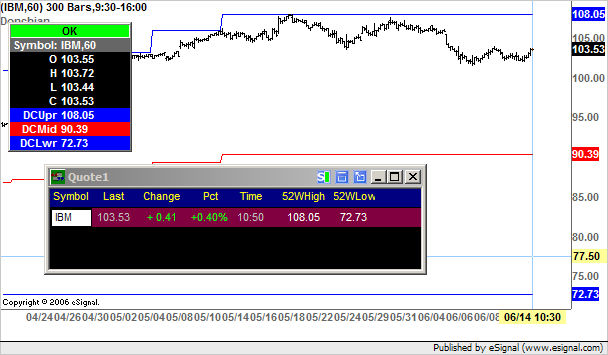
    That will plot the highest High and the lowest Low [and the midpoint between the two] for the last 52 weeks.
    Alex


    Comment


    • #3
      ok, thank you...that does plot the hi and low...now...do you know how if stockk is trading at say 15 with hi/lo 32/7 that the candles dont get squished. i dont mind not seeing the line until it is trading close enough that my chart would be there. does that make sense? thank you very much!

      Comment


      • #4
        draeihle
        That can be easily done. Right click the chart then from the context menu select Scaling-> Scale Price Data Only or click the icon for that function which is in the Advanced Chart Toolbar
        Alex

        Comment


        • #5
          that is it! thank you. not sure if you work for esignal but you seem very knowledgable and after months i think i have it. thank you again

          Comment


          • #6
            draeihle
            You are most welcome and thank you for the compliment.
            No, I am not an employee of eSignal even though I am one of the moderators of these forums
            Alex

            Comment


            • #7
              one more question

              when i try the same on a daily chart i do not get the same result. is there a different parameter i should be using?
              again, thank you.

              Comment


              • #8
                draeihle
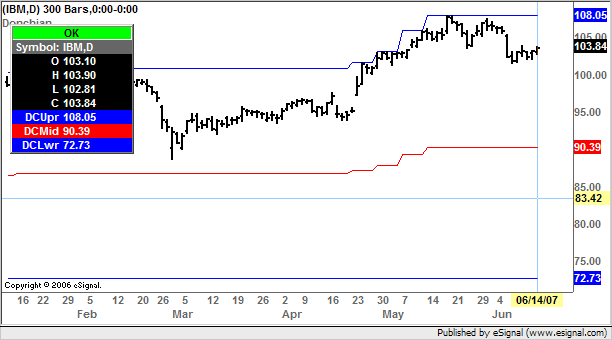
                It should be returning the same values also on a daily chart without any changes in the parameters (see enclosed screenshot)
                Alex

                Comment

                Working...
                X