Announcement

Collapse
No announcement yet.

Volume indicator

Collapse
X
 
  • Filter
  • Time
  • Show
Clear All
new posts

  • Volume indicator

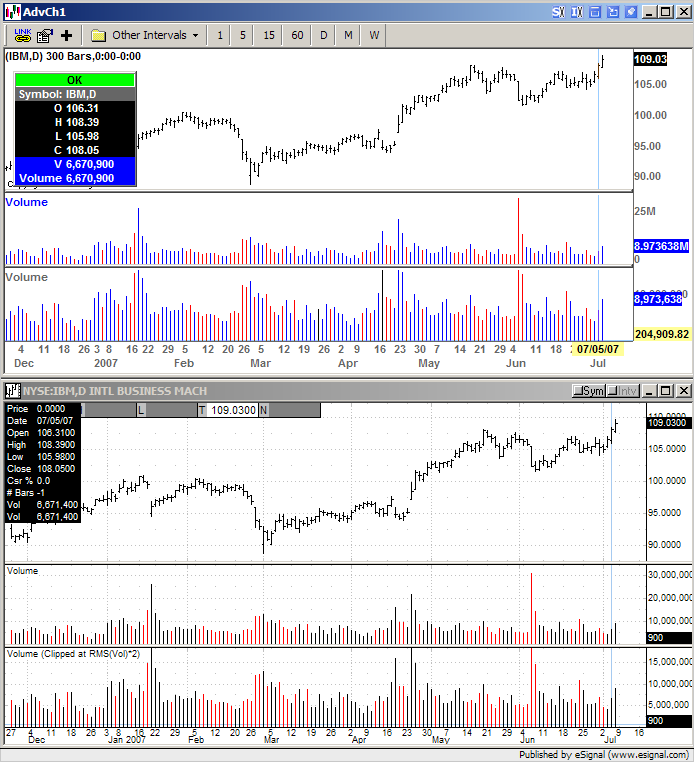
    Would it be possible to have the scaling of the volume indicator the same as an advanced chart?

    When I get a huge volume spike all other vol bars are unreadable and if I manually rescale larger all the bars disapear under the viewable section of the volume box, under the screen.

    Cheers
    Russell

  • #2
    >Rustie

    I agree with you 100%. It's a real pain. The function is
    in the y-axis of the Advanced Chart. It would seem so
    simple to apply it to the volume scale, and make eSignal
    charts just that much better. I wrote to [email protected] suggesting this about a year ago. You may want give it
    a try too.

    jay

    Comment


    • #3
      Hey guys, don't hold your breath waiting for this one. It's been requested for many years, by many people, here, through Ideas and via the EliteTrader forum.

      BKuerbs developed an EFS for volume spike filtering back in May, 2004 http://forum.esignalcentral.com/show...t=volume+spike that may help you.

      Regards
      shaeffer

      Comment


      • #4
        >shaeffer

        Alex also recommended that EFS and I have been using it
        ever since(thanks again Alex). It's ok, but a far cry from what eSignal could provide. They've created so many wonderful and complicated functions, and I just can't understand why they have skipped this very basic one.

        jay

        Comment


        • #5
          Vol EFS

          Cheers, Thanks for that! Something so simple hey.

          Just wondering about the settings for the EFS.
          What does the factor setting do?
          And how does it relate to the MA length?

          Comment


          • #6
            Russell
            The Factor parameter increases/decreases the spike "clipping" sensitivity. This is based on a moving average which is used to determine the sample data.
            Attached is a similar script that instead of using a moving average it bases its calculations on the regression of all the historical volume data. I believe this method is somewhat similar to that used in some other charting packages such as for example QCharts. The default value for the factor is set to 2 which should function in most conditions (lower values increase the clipping while higher values decrease the clipping). Also included is a manual override which allows the user to set a specific Volume clipping value
            In the first chart enclosed below you can see the regular Volume study (in the top pane) compared to the one plotted by the efs.
            In the second chart the same symbol is plotted in Qcharts with and without the Volume clipping which is based on RMS (root mean square) of Volume
            Alex

            Attached Files

            Comment


            • #7
              >Alex

              I have replaced B Kuerbs' volume autoclipv6.efs with your
              volume(clip).efs having found it to be preferable mainly due
              to its manual override function.

              Thak you very much for this EFS.

              jay

              Comment


              • #8
                jay
                You are most welcome and thank you for letting me know that you are finding it useful
                Alex

                Comment


                • #9
                  Thanks heaps guys guys, appreciate your help a lot!
                  Cheers

                  Comment


                  • #10
                    Alex

                    The Volume EFS works great. But is there a way to delete
                    the title? The reason is that on a small chart the title and
                    the following numbers reach across to the y-axis
                    making it hard sometimes to read the most recent volume
                    bars.

                    Thank you,
                    jay

                    Comment


                    • #11
                      Jay
                      To prevent displaying the parameter list in the study title add the following statement in the preMain function of the efs
                      setShowTitleParameters(false);
                      Alternatively you can right click the chart, select Properties and uncheck the Draw Study Titles option. Note that this will remove the study titles of all the studies loaded in a chart.
                      Alex

                      Comment


                      • #12
                        >Alex

                        Thank you very much for your help.

                        Jay

                        Comment


                        • #13
                          Jay
                          You are most welcome
                          Alex

                          Comment

                          Working...
                          X