Announcement

Collapse
No announcement yet.

Moving Average of Relative Strength Ratio

Collapse
X
 
  • Filter
  • Time
  • Show
Clear All
new posts

  • Moving Average of Relative Strength Ratio

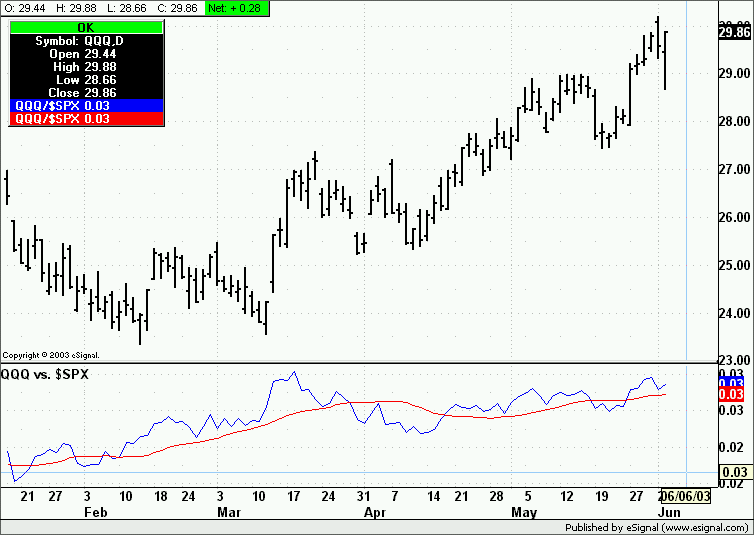
    If any of you are interested, Chris Kryza of Divergence Software was kind enough to create this indicator for me. It is a simple moving average of a relative strength ratio where you can change both the comparative and the length of the moving average. The default comparative is the $SPX and the default length is 20 periods.

    Thanks

    Brad
    Attached Files

  • #2
    Question...

    When I change stocks, why does the value for the index change?

    Seems to me no matter what stock I am looking at, the index value should be the same from stock to stock.

    FYI:

    I think this makes the cursor box a little more readable...

    function preMain() {
    if (vLoaded == false) {
    setDefaultBarFgColor(Color.blue, 0);
    setDefaultBarFgColor(Color.red, 1);
    } else {
    if (vEdit == false) {
    setStudyTitle(cSym + " vs. " + vSym + " ");
    setCursorLabelName(cSym, 0);
    setCursorLabelName(vSym, 1);
    } else {
    setStudyTitle(cSym + " vs. ");
    setCursorLabelName(cSym, 0);
    setCursorLabelName(vSym, 1);
    }
    }

    for (x=0; x<100; x++) {
    aData[x] = 0.0;
    }

    }

    Comment


    • #3
      Avery
      Because the Relative strength plot is not that of the index but that of the ratio of the symbol you loaded in the chart and the index.
      Alex

      Comment


      • #4
        Alex,

        This formula does not return the actual values of the Relative Strength line or the Moving Average in the quote window. Would it be relatively easy to modify the current formula so that these values are shown?

        Thanks

        Comment


        • #5
          Brad
          It seems that the values are reported in the Cursor Window (see image).


          The only change I made to the attached efs was to add a line in the formula to show the symbols in the label of the MA instead of the name of the efs.
          Alex
          Attached Files

          Comment


          • #6
            Hi Alex,

            It does post values, however, the values remains the same no matter what price bar you are looking at. It looks like it is just an ambiguous figure being posted.

            Thanks

            Comment


            • #7
              Brad
              That is because it only plots two decimals whereas you would need at least 3 or 4 to notice some variation.
              As an experiment try the following.
              In Line 38 of the formula it should say
              vSym = "$SPX";
              Change that to
              vSym = 0.1+"$SPX";
              or even
              vSym = 0.01+"$SPX";
              The values for the ratio in the Cursor Window should now visibly change as you scroll around the chart
              Alex

              Comment


              • #8
                That would make sense. Thanks Alex. I'll give your suggestion a go after the markets close.

                Thanks

                Comment

                Working...
                X