 Tweet
Tweet
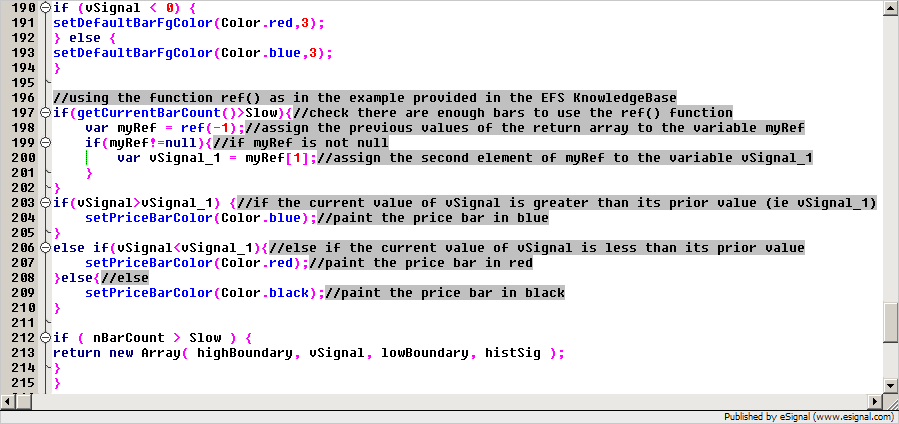
I have been trying to get the price bars to color based upon the slope of the indicator line (efs below). I simply want the price bars to be blue when the slope of the line is positive; red when the slope of the line is negative. I tried changing if (vSignal < 0) to if (vSignal < vSignal (-1)), along with the premain setColorPriceBars(true), but can't get it to work. I also added a default ColorPriceBar. Could someone show me my errors, and how to get it fixed?
Thanks,
Steve
/************************************************** ******************
Title: Chaikin Oscillator for eSignal 7.x
By: Chris D. Kryza (Divergence Software, Inc.)
Email: [email protected]
Incept: 09/08/2003
Version: 1.0.0
==================================================
===================
Fix History:
09/08/2003 - Initial Release
1.0.0
==================================================
===================
Project Description:
Calculates the Chaikin Oscillator which is the difference between
two exponential averages of the accumulation/distribution line.
If you come across any fixes or have any ideas on how to spruce it up, I
would appreciate it if you would let me know ([email protected]).
Dislaimer: For educational purposes only! Obviously, no guarantees
whatsoever and use at your own risk.
************************************************** ********************/
//Global Variables
var grID = 0;
var nBarCount = 0;
var nAD = 0;
var nADCum = 0;
var nCoeff1 = 0;
var nCoeff2 = 0;
var nEMA1 = 0;
var nEMA2 = 0;
var Num = 0;
var vSignal = 0;
var lateHigh = 0;
var lateLow = 0;
var highBoundary = 0;
var lowBoundary = 0;
var testSum = 0;
var testSum2 = 0;
var histSig = 0;
var bInitialized = false;
var accumltr = 0;
var aFPArray = new Array();
var aADArray = new Array();
var aEMA1 = new Array();
var aEMA2 = new Array();
var aSigArray = new Array(5);
//== PreMain function required by eSignal to set things up
function preMain() {
var x;
var y;
setPriceStudy(false);
setStudyTitle("Net Change Volume");
setCursorLabelName("High", 0);
setCursorLabelName("Signal", 1);
setCursorLabelName("Low", 2);
setCursorLabelName("Histogram", 3);
setDefaultBarFgColor(Color.black,0);
setDefaultBarFgColor(Color.paleyellow,1);
setDefaultBarFgColor(Color.black,2);
setDefaultBarFgColor(Color.blue,3);
setPlotType( PLOTTYPE_DOT, 0);
setPlotType( PLOTTYPE_LINE, 1);
setPlotType( PLOTTYPE_DOT, 2);
setPlotType( PLOTTYPE_HISTOGRAM, 3);
setDefaultBarThickness( 3, 0 );
setDefaultBarThickness( 2, 1 );
setDefaultBarThickness( 3, 2 );
setDefaultBarThickness( 4, 3);
addBand( 0, PS_SOLID, 2, Color.black, -10 );
grID = 0;
//initialize formula parameters
x=0;
aFPArray[x] = new FunctionParameter( "Fast", FunctionParameter.NUMBER);
with( aFPArray[x] ) {
setLowerLimit( 1 );
setUpperLimit( 100 );
setDefault( 3 );
}
x++;
aFPArray[x] = new FunctionParameter( "Slow", FunctionParameter.NUMBER);
with( aFPArray[x] ) {
setLowerLimit( 1 );
setUpperLimit( 200 );
setDefault( 10 );
}
x++;
aFPArray[x] = new FunctionParameter( "LineColor", FunctionParameter.COLOR);
with( aFPArray[x] ) {
setDefault( Color.black );
}
x++;
aFPArray[x] = new FunctionParameter( "LineThickness", FunctionParameter.NUMBER);
with( aFPArray[x] ) {
setLowerLimit( 1 );
setUpperLimit( 20 );
setDefault( 3 );
}
for ( x=0; x<10; x++ ) {
aADArray[x] = 0.0;
aEMA1[x] = 0.0;
aEMA2[x] = 0.0;
}
for ( y=0; y<5; y++ ) {
aSigArray[y] = 0.0;
}
}
//== Main processing function
function main( Fast, Slow, LineColor, LineThickness ) {
var x;
//script is initializing
if ( getBarState() == BARSTATE_ALLBARS ) {
return null;
}
if ( bInitialized == false ) {
nCoeff1 = 2 / (Fast+1);
nCoeff2 = 2 / (Slow+1);
setDefaultBarFgColor( LineColor, 0 );
setDefaultBarThickness( LineThickness, 0 );
bInitialized = true;
}
//called on each new bar
if ( getBarState() == BARSTATE_NEWBAR ) {
nBarCount++;
if((getHour(0)*100)+getMinute(0)==930){
yourcounter = 0;
}
aADArray.pop();
aADArray.unshift( 0 );
aEMA1.pop();
aEMA1.unshift( nEMA1 );
aEMA2.pop();
aEMA2.unshift( nEMA2 );
aSigArray.pop();
aSigArray.unshift( vSignal);
nADCum += nAD;
}
testSum = aSigArray[0] + 600000.0;
testSum2 = aSigArray[0] - 600000.0;
if((vSignal > 0.0 ) && (vSignal > testSum)) {
alertFunction(1);
setDefaultBarFgColor(Color.lime,1);
setDefaultBarThickness( 4, 1 );
} else if ((vSignal > highBoundary ) && (vSignal < testSum)) {
alertFunction(0);
setDefaultBarFgColor(Color.RGB(255,157,255),1);
setDefaultBarThickness( 4, 1 );
} else {
setDefaultBarFgColor(Color.black,1);
setDefaultBarThickness( 2, 1 );
}
if(vSignal > lateHigh ) lateHigh = vSignal;
highBoundary = .4 * lateHigh;
if(vSignal < lateLow ) lateLow = vSignal;
lowBoundary = .4 * lateLow;
nAD = ( volume() * ( (( close()-low() ) - ( high()-close() )) / ( high()-low() ) ) );
if ( isNaN( nAD ) )
nAD = 0;
aADArray[0] = nADCum + nAD;
nEMA1 = ( aADArray[0] * nCoeff1 ) + ( aEMA1[0] * ( 1.0-nCoeff1 ) );
nEMA2 = ( aADArray[0] * nCoeff2 ) + ( aEMA2[0] * ( 1.0-nCoeff2 ) );
vSignal = nEMA1 - nEMA2 ;
histSig = vSignal;
time = getHour()*100+getMinute()*1;
if (time > 625)
accumltr = accumltr + vSignal;
/*
debugPrintln();
debugPrintln("time: " + time);
debugPrintln("Net Chaikin (in Ms): " + formatPriceNumber(accumltr/1000000));
debugPrintln("vSignal:" + vSignal);
debugPrintln("nBarCount:" + nBarCount);
*/
// "TIB1")
if (accumltr/1000000 >= 0)
drawTextRelative(2,-100," "+formatPriceNumber(accumltr/1000000)+"M",Color.lime,null,Text.BOLD|Text.VCENTE R,"Arial",20,30);
else
drawTextRelative(2,-100," "+formatPriceNumber(accumltr/1000000)+"M",Color.RGB(192,0,120),null,Text.BOLD|T ext.VCENTER,"Arial",20,30);
if (vSignal < 0) {
setDefaultBarFgColor(Color.red,3);
} else {
setDefaultBarFgColor(Color.blue,3);
}
if ( nBarCount > Slow ) {
return new Array( highBoundary, vSignal, lowBoundary, histSig );
}
}
/*************************************************
SUPPORT FUNCTIONS
**************************************************/
//== gID function assigns unique identifier to graphic/text routines
function gID() {
grID ++;
return( grID );
}
function alertFunction(Num) {
if(Num == 1) {
Alert.playSound("C:\\Program Files\\eSignal\\Sounds\\Applause.wav");
Alert.playSound("C:\\Program Files\\eSignal\\Sounds\\Applause.wav");
} else {
Alert.playSound("C:\\Program Files\\eSignal\\Sounds\\Glassbrk.wav");
Alert.playSound("C:\\Program Files\\eSignal\\Sounds\\Glassbrk.wav");
}
}
Comment