 Tweet
Tweet
Any one out there have a Macd BB with trend dots or can convert two indicators to EFS files. One indicator is a EFS file but it comes up with an error, please send me a copy if you have one as a attachment to [email][email protected]
-
Last edited by Fred Waithe; 07-16-2008, 06:49 PM. -
Hi there,
I noticed this post is a few days old.
Whilst you are waiting for a response, may I suggest you check through the information here
Kind Regards, -
Fred,
Here is the converted code, hope it helps.
Yours EMET
PHP Code://Developed by EMET
//MACD BB Lines
/*
Any one out there have a Macd BB with trend dots or can convert two indicators
to EFS files. One indicator is a EFS file but it comes up with an error, please
send me a copy if you have one as a attachment to [email][email protected]
*/
var fpArray = new Array();
function preMain() {
setPriceStudy(false);
setStudyTitle("MACD BB Lines");
setCursorLabelName("BB_UpperBand", 0);
setCursorLabelName("BB_LowerBand", 1);
setCursorLabelName("Null_Line", 2);
setCursorLabelName("BB_DOT_Line_Black", 3);
setCursorLabelName("BB_DOT_Line_Color", 4);
setCursorLabelName("Signal_DOT_Line", 5);
setDefaultBarFgColor(Color.red, 0);
setDefaultBarFgColor(Color.blue, 1);
setDefaultBarFgColor(Color.blue, 2);
setDefaultBarFgColor(Color.black, 3);
setDefaultBarFgColor(Color.lime, 4);
setDefaultBarFgColor(Color.yellow, 5);
setDefaultBarThickness(1, 0);
setDefaultBarThickness(1, 1);
setDefaultBarThickness(1, 2);
setDefaultBarThickness(3, 3);
setDefaultBarThickness(2, 4);
setDefaultBarThickness(4, 5);
setPlotType(PLOTTYPE_LINE, 0);
setPlotType(PLOTTYPE_LINE, 1);
setPlotType(PLOTTYPE_LINE, 2);
setPlotType(PLOTTYPE_DOT, 3);
setPlotType(PLOTTYPE_DOT, 4);
setPlotType(PLOTTYPE_DOT, 5);
//Other param
askForInput();
var x=0;
fpArray[x] = new FunctionParameter("Fast", FunctionParameter.NUMBER);
with(fpArray[x++]){
setLowerLimit(0);
setDefault(12);
}
fpArray[x] = new FunctionParameter("Period", FunctionParameter.NUMBER);
with(fpArray[x++]){
setLowerLimit(0);
setDefault(10);
}
fpArray[x] = new FunctionParameter("Slow", FunctionParameter.NUMBER);
with(fpArray[x++]){
setLowerLimit(0);
setDefault(26);
}
fpArray[x] = new FunctionParameter("Smooth", FunctionParameter.NUMBER);
with(fpArray[x++]){
setLowerLimit(0);
setDefault(5);
}
fpArray[x] = new FunctionParameter("StDev", FunctionParameter.NUMBER);
with(fpArray[x++]){
setLowerLimit(0);
setDefault(1);
}
}
var bInit = false;
var SDev = null;
var bbMacd = null;
var Avg = null;
var FlagDOWN = false;
function main(Fast, Period, Slow, Smooth, StDev) {
var nbbMacd;
var nAvg;
var nSDev;
var upperBand;
var lowerBand;
var macdVal;
var prevMacdVal;
var SignalLine;
if (bInit == false) {
bbMacd = macd(Fast, Slow, Smooth);
Avg = ema(Period, bbMacd);
SDev = efsInternal("StdDev", bbMacd, Period);
bInit = true;
}
nbbMacdV = bbMacd.getValue(0);
nAvg = Avg.getValue(0);
nSDev = SDev.getValue(0);
macdVal = bbMacd.getValue(0);
prevMacdVal = bbMacd.getValue(-1);
upperBand = nAvg + (StDev * nSDev);
lowerBand = nAvg - (StDev * nSDev);
setBarBgColor(Color.lightgrey, 0, lowerBand, upperBand);
if (macdVal > prevMacdVal) {
setDefaultBarFgColor(Color.lime, 4);
} else {
setDefaultBarFgColor(Color.red, 4);
}
if (macdVal > 0) {
setDefaultBarFgColor(Color.blue, 2);
if (FlagDOWN == true) {
SignalLine = 0;
FlagDOWN = false;
}
} else {
setDefaultBarFgColor(Color.red, 2);
if (FlagDOWN == false) {
SignalLine = 0;
FlagDOWN = true;
}
}
return new Array (upperBand, lowerBand, 0, macdVal, macdVal, SignalLine);
}
/************************************************
Standard Deviation
*************************************************/
function StdDev(DataArray, Period) {
var sum = 0;
var avg = 0;
var res = 0;
for (var barsBack = Period-1; barsBack >= 0; barsBack--) {
sum += DataArray.getValue(barsBack*(-1));
}
avg = sum / Period;
sum = 0;
for (var barsBack = Period - 1; barsBack >= 0; barsBack--) {
sum += (DataArray.getValue(barsBack*(-1))-avg)*(DataArray.getValue(barsBack*(-1))-avg);
}
res = Math.sqrt(sum / Period);
return res;
}
Attached FilesComment
-
-
still looking for working BB Macd
I am still looking for a working BB Macd efs, that has no errors. Has anyone found one yet?Comment
-
Re: still looking for working BB Macd
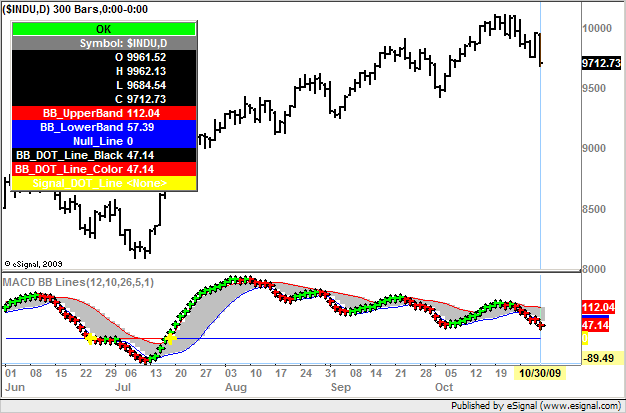
USDIVERS
The formula posted by emet in this thread appears to be working fine (see enclosed screenshot)
Alex
Originally posted by USDIVERS
I am still looking for a working BB Macd efs, that has no errors. Has anyone found one yet?Comment
-
I am wondering if anybody could help to modify or add this to make the dots a diamond when they are above the upperBand and the lowerBand.
fankcComment
-
Hi,
I need help to program when macdVal is above upperBand, do this else so somthing else.
When i chart this, the chart do what i required, but after that it doen't work. Only when you reload the chart, it works. What happen ?
Appreciate if someone can help me.
I put something like
If (macdVal > upperBand) {
something here;
}
} else if(macdVal < lowerBand){
somrthing here
}
fankcComment
-
Oh--adding the plot to the end of the list is a bad idea--will draw on top. You can reorder the returned array (you'll have to make changes to the plot defaults in preMain, since the index of some of the plots will change).Comment
-
BTW, I just discovered the MACD BB indicator, when I looked at the Nexgen T3 site, but so far every implementation I've seen let's the user set MACD smoothing. Since MACD smoothing is for the MACD signal line, and none of these studies use the signal line, you'll find that it's pointless to include it in the user parameters.
Also, no need to roll your own Bollinger Bands--esignal has a built-in study. For example:
Code:gMACD = null; gUpperBB = null; gLowerBB = null; function main(MACD_fast, MACD_slow, BB_length, BB_std) { // instantiate studies first time if (gMACD == null) { gMACD = macd(MACD_fast, MACD_slow, 1); gUpperBB = upperBB(BB_length, BB_std, gMACD); gUpperBB = lowerBB(BB_length, BB_std, gMACD); } // plot Bollinger Bands and MACD return new Array(gLowerBB.getValue(0), gUpperBB.getValue(0), gMACD.getValue(0)); }Comment
Comment