 Tweet
Tweet
Am betting this has been done, but can't seem to find it. Looking for a plot of the real-time difference between the current price and a given moving average (preferably with option to edit MA length).
-
-
Just use the basic or the custom price oscillator with the shortest ma being 1 and the longer whatever you want. -
Thanks for the reply, but I don't think it's what I'm looking for. Not looking for the difference between MAs. I probably wasn't clear enough. Perhaps I should state my goal.
I want to see what the actual difference between the current price (Last) and the current value for the SMA (let's say a 50SMA). Example: Last Price 1295; Current SMA value: 1297 = Difference of -2 pts.
The idea being that when price has pulled a more significant distance away (let's say 10 pts), the chance for reversal or pullback grows.Comment
-
FredB
A moving average of 1 period (as suggested in the previous reply) is the same as using the price itself
Having said that the Price Oscillator may not be the study you want as it uses the equation
((fastMA-slowMA)/fastMA)*100
thereby returning the difference as a percentage and not as price
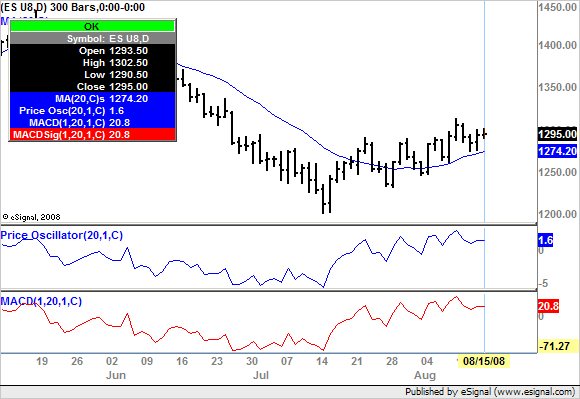
The indicator that you may want to use instead is the MACD with the FastLen set to 1, SlowLen set to the length of the desired average and Signal Smoothing also set to 1. For example 1,20,1 would calculate the difference between the current price and a 20 period moving average and return that as price. An additional benefit is that if you want to plot an average of the difference you can do that just by setting the appropriate length in the Signal Smoothing parameter
In the screenshot enclosed below you can see the different values returned by the Price Oscillator and by the MACD set to 1, 20 and 1, 20, 1 respectively. In the price window you can also see a 20 period moving average and if you calculate the difference between the current price and the average shown in the price window you will see that it matches the value returned by the MACD. In fact 1295.00 minus 1274.20 is equal to 20.8
Alex
Originally posted by FredB
Thanks for the reply, but I don't think it's what I'm looking for. Not looking for the difference between MAs. I probably wasn't clear enough. Perhaps I should state my goal.
I want to see what the actual difference between the current price (Last) and the current value for the SMA (let's say a 50SMA). Example: Last Price 1295; Current SMA value: 1297 = Difference of -2 pts.
The idea being that when price has pulled a more significant distance away (let's say 10 pts), the chance for reversal or pullback grows.
Originally posted by johnsykes
Just use the basic or the custom price oscillator with the shortest ma being 1 and the longer whatever you want.Comment
-
Genius.
Thanks, Alexis. It's exactly what I meant. I never would have considered MACD.
I just tried it and immediately found the countertrend signal I was looking for.Comment
-
FredB
You are most welcome
Alex
Originally posted by FredB
Genius.
Thanks, Alexis. It's exactly what I meant. I never would have considered MACD.
I just tried it and immediately found the countertrend signal I was looking for.Comment
Comment