Announcement

Collapse
No announcement yet.

Opening Range Time Parameters

Collapse
X
 
  • Filter
  • Time
  • Show
Clear All
new posts

  • Opening Range Time Parameters

    Hello,
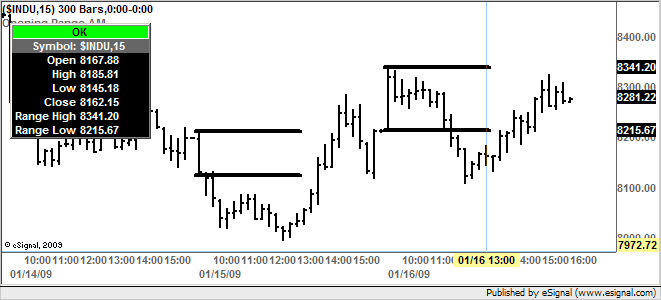
    I'm new and would appreciate any assistance. I am trying to modify the opening range efs to draw the extended lines only to a certain time on the chart and then have them stop. For example, using 9:30 - 9:45 a.m. as the opening range, I would like the lines to extend only to 1:00 p.m. (or 13:00) of the same day and then stop at that designated time in the edit study window. Thank you in advance.
    Last edited by turbotrade; 01-17-2009, 11:38 AM.

  • #2
    Opening Range Parameters

    I am having trouble attaching the efs for my previous post. Following is the code I'm using. Thank you again for any help.


    /************************************************** *******
    File Resides on PureTick.Com - Live Day Trading Futures Calls and Education

    Learning While Profiting - Check out our track record, updated bi-daily

    Moded by Dragon Breath..slightly.. just a tadd bit
    ************************************************** ********/

    var fpArray = new Array();

    function preMain() {

    setPriceStudy(true);
    setStudyTitle("Opening Range AM");
    setCursorLabelName("Range High", 0);
    setCursorLabelName("Range Low", 1);
    setPlotType(PLOTTYPE_FLATLINES,0);
    setPlotType(PLOTTYPE_FLATLINES,1);
    setDefaultBarFgColor(Color.black,0);
    setDefaultBarFgColor(Color.black,1);
    setDefaultBarThickness(4,0);
    setDefaultBarThickness(4,1);
    setShowTitleParameters(false)

    var x=0;
    fpArray[x] = new FunctionParameter("xStart", FunctionParameter.NUMBER);
    with(fpArray[x++]){
    setName("Start Time");
    setLowerLimit(0);
    setDefault(930);
    }
    fpArray[x] = new FunctionParameter("xEnd", FunctionParameter.NUMBER);
    with(fpArray[x++]){
    setName("End Time");
    setLowerLimit(0);
    setDefault(945);
    }
    fpArray[x] = new FunctionParameter("xInterval", FunctionParameter.NUMBER);
    with(fpArray[x++]){
    setName("Ext Interval Used");
    setLowerLimit(1);
    setDefault(3);
    }
    fpArray[x] = new FunctionParameter("xDisplay", FunctionParameter.STRING);
    with(fpArray[x++]){
    setName("Display");
    addOption("Show");
    addOption("Hide");
    setDefault("Show");
    }
    }

    var bInit = false;
    var xRange = null;
    var vReturn=0;

    function main(xStart,xEnd,xInterval,xDisplay) {

    if ( getBarState() == BARSTATE_ALLBARS ) return; // Exit Script if we are loading still

    vReturn=0;

    if(bInit==false){
    xRange = efsInternal("calcOR",xStart,xEnd,xDisplay,inv(xInt erval));
    bInit=true;
    }

    //setBarBgColor(Color.RGB(241,255,241), 0, getSeries(xRange,1), getSeries(xRange,0) )

    //if ( getBarState() == BARSTATE_NEWBAR && close() > getSeries(xRange,0) ) debugPrintln("We are over opening range");
    //if ( getBarState() == BARSTATE_NEWBAR && close() < getSeries(xRange,1) ) debugPrintln("We are BELOW opening range");

    return new Array(getSeries(xRange,0),getSeries(xRange,1));
    }


    var vFlag = true;
    var vFlag2 = true
    var vHigh = null;
    var vLow = null;
    var vClose = null;
    var vDay1 = null;
    var vDay2 = null;

    function calcOR(start,end,display,source){

    if (getBarState() == BARSTATE_NEWBAR) {
    if (vDay1 == null) {
    vDay2 = getDay(0);
    } else {
    vDay2 = vDay1;
    }
    vDay1 = getDay(0);
    if (vDay1 != vDay2) {
    vHigh = null;
    vLow = null;
    vFlag = true;
    vFlag2 = false;
    }
    var vHour1 = (getHour()*100)+getMinute();
    if(vHour1 >= start){
    vFlag2=true;
    }
    var vHour = (getHour()*100)+getMinute();
    if (vHour >= end) {
    vFlag = false;
    vFlag2=false;
    }
    }

    if (vFlag == true&&vFlag2==true) {
    if (vHigh == null) {
    vHigh = high(0);
    }
    if (vLow == null) {
    vLow = low(0);
    }
    vHigh = Math.max(high(0), vHigh);
    vLow = Math.min(low(0), vLow);
    }

    if(display=="Hide"){
    if(vFlag==false&&vHigh!=null&&vLow!=null){
    var vHigh2 = vHigh;
    var vLow2 = vLow;
    }
    }else if(display=="Show"){
    var vHigh2 = vHigh;
    var vLow2 = vLow;
    }


    return new Array(vHigh2,vLow2);
    }

    Comment


    • #3
      Re: Opening Range Parameters

      turbotrade
      Add the following line of code just before the return statement in the main function
      PHP Code:
      if((hour(0)*100)+minute(0)>1300) return; 
      and the lines will terminate at 1300 (see enclosed screenshot).
      FWIW the original version of that script was posted here
      If - as you indicate - you are new to programming in efs and you are interested in learning then I would suggest that you begin by reviewing the JavaScript for EFS video series and the Core JavaScript Reference Guide. Those will provide you with a thorough introduction to programming in JavaScript which is at the foundation of EFS. Then go through the EFS KnowledgeBase and study the Help Guides and Tutorials which will provide you with the specifics of EFS.
      Alex


      Originally posted by turbotrade
      I am having trouble attaching the efs for my previous post. Following is the code I'm using. Thank you again for any help.


      /************************************************** *******
      File Resides on PureTick.Com - Live Day Trading Futures Calls and Education

      Learning While Profiting - Check out our track record, updated bi-daily

      Moded by Dragon Breath..slightly.. just a tadd bit
      ************************************************** ********/

      var fpArray = new Array();

      function preMain() {

      setPriceStudy(true);
      setStudyTitle("Opening Range AM");
      setCursorLabelName("Range High", 0);
      setCursorLabelName("Range Low", 1);
      setPlotType(PLOTTYPE_FLATLINES,0);
      setPlotType(PLOTTYPE_FLATLINES,1);
      setDefaultBarFgColor(Color.black,0);
      setDefaultBarFgColor(Color.black,1);
      setDefaultBarThickness(4,0);
      setDefaultBarThickness(4,1);
      setShowTitleParameters(false)

      var x=0;
      fpArray[x] = new FunctionParameter("xStart", FunctionParameter.NUMBER);
      with(fpArray[x++]){
      setName("Start Time");
      setLowerLimit(0);
      setDefault(930);
      }
      fpArray[x] = new FunctionParameter("xEnd", FunctionParameter.NUMBER);
      with(fpArray[x++]){
      setName("End Time");
      setLowerLimit(0);
      setDefault(945);
      }
      fpArray[x] = new FunctionParameter("xInterval", FunctionParameter.NUMBER);
      with(fpArray[x++]){
      setName("Ext Interval Used");
      setLowerLimit(1);
      setDefault(3);
      }
      fpArray[x] = new FunctionParameter("xDisplay", FunctionParameter.STRING);
      with(fpArray[x++]){
      setName("Display");
      addOption("Show");
      addOption("Hide");
      setDefault("Show");
      }
      }

      var bInit = false;
      var xRange = null;
      var vReturn=0;

      function main(xStart,xEnd,xInterval,xDisplay) {

      if ( getBarState() == BARSTATE_ALLBARS ) return; // Exit Script if we are loading still

      vReturn=0;

      if(bInit==false){
      xRange = efsInternal("calcOR",xStart,xEnd,xDisplay,inv(xInt erval));
      bInit=true;
      }

      //setBarBgColor(Color.RGB(241,255,241), 0, getSeries(xRange,1), getSeries(xRange,0) )

      //if ( getBarState() == BARSTATE_NEWBAR && close() > getSeries(xRange,0) ) debugPrintln("We are over opening range");
      //if ( getBarState() == BARSTATE_NEWBAR && close() < getSeries(xRange,1) ) debugPrintln("We are BELOW opening range");

      return new Array(getSeries(xRange,0),getSeries(xRange,1));
      }


      var vFlag = true;
      var vFlag2 = true
      var vHigh = null;
      var vLow = null;
      var vClose = null;
      var vDay1 = null;
      var vDay2 = null;

      function calcOR(start,end,display,source){

      if (getBarState() == BARSTATE_NEWBAR) {
      if (vDay1 == null) {
      vDay2 = getDay(0);
      } else {
      vDay2 = vDay1;
      }
      vDay1 = getDay(0);
      if (vDay1 != vDay2) {
      vHigh = null;
      vLow = null;
      vFlag = true;
      vFlag2 = false;
      }
      var vHour1 = (getHour()*100)+getMinute();
      if(vHour1 >= start){
      vFlag2=true;
      }
      var vHour = (getHour()*100)+getMinute();
      if (vHour >= end) {
      vFlag = false;
      vFlag2=false;
      }
      }

      if (vFlag == true&&vFlag2==true) {
      if (vHigh == null) {
      vHigh = high(0);
      }
      if (vLow == null) {
      vLow = low(0);
      }
      vHigh = Math.max(high(0), vHigh);
      vLow = Math.min(low(0), vLow);
      }

      if(display=="Hide"){
      if(vFlag==false&&vHigh!=null&&vLow!=null){
      var vHigh2 = vHigh;
      var vLow2 = vLow;
      }
      }else if(display=="Show"){
      var vHigh2 = vHigh;
      var vLow2 = vLow;
      }


      return new Array(vHigh2,vLow2);
      }

      Comment


      • #4
        Alexis,
        Thank you so very much for your solution and guidance. All worked easily and perfectly.

        Comment


        • #5
          turbotrade
          You are most welcome
          Alex


          Originally posted by turbotrade
          Alexis,
          Thank you so very much for your solution and guidance. All worked easily and perfectly.

          Comment


          • #6
            Hi Alex,

            I tried using HiLoXMinutes2 (blue) but it only draw the line on the first 5 days. What do I need to change so it will draw on all the charts.

            I'm putting the old HiLoXminutes (green) and it draw correctly.

            Thank you for your help.

            Tony
            Attached Files

            Comment


            • #7
              Tony
              You are only getting 5 days because the interval used in the efs [default is 5 minutes] is very likely smaller that the one used in the chart and in the Time Template that interval is either set to Dynamic or to a number of bars/days that is less than those set for the chart (note that it is not possible to determine from the image you posted if this is the case).
              For example if your Time Template is set to Dynamic for all intraday intervals and you are plotting a 15 minute chart that means that the program will load enough 15 minute bars to fill the chart [300 by default]. When you load the efs this is set by default to use the 5 minute interval so the efs will load in the background also 300 bars of 5 minute data. Because 300 bars on a 5 minute interval will cover less time than 300 bars on a 15 minute interval the plots returned by the efs will not go back as far as the bars plotted on the chart.
              There are a couple of solutions available to you that do not require any coding
              - set the interval in the efs to match that of the chart
              - set the Time Template to load an equal amount of days [not bars] for both intervals. For all information on Time Templates and instructions on how to use them see this article in the eSignal KnowledgeBase
              FYI the reason the old[er] script plots on all historical bars is that it only uses the chart interval to calculate the range of the first x minutes (in other words it uses the same logic as in the first solution I suggested above). While this is easier to use it does not always return the correct results if the interval does not fit exactly in the time frame used to define the opening range [for example you are using a 30 minute chart and want the range of the first 45 minutes]. This is why I subsequently wrote a revised version of that script that resolves this issue
              Alex


              Originally posted by tonhar
              Hi Alex,

              I tried using HiLoXMinutes2 (blue) but it only draw the line on the first 5 days. What do I need to change so it will draw on all the charts.

              I'm putting the old HiLoXminutes (green) and it draw correctly.

              Thank you for your help.

              Tony

              Comment


              • #8
                Alex,

                Thank you it work. I change the time template from dynamic to 1000 bars

                Tony

                Comment


                • #9
                  Tony
                  You are most welcome
                  Alex


                  Originally posted by tonhar
                  Alex,

                  Thank you it work. I change the time template from dynamic to 1000 bars

                  Tony

                  Comment

                  Working...
                  X