Announcement

Collapse
No announcement yet.

Time Histogram

Collapse
X
 
  • Filter
  • Time
  • Show
Clear All
new posts

  • Time Histogram

    I am using tick charts and need to put a Time Histogram as an indicator window at the bottom of the Chart.
    Does anyone know how to do this??
    Thanks...Daniel Sternthal

  • #2
    Re: Time Histogram

    Daniel
    A very basic and simple way to do what you want is to calculate the difference between the timestamps of the bars using rawtime() [which returns the number of seconds elapsed from January 1st 1970] and plot the result as a histogram as shown in the enclosed code example (which includes some comments)
    Alex

    PHP Code:
    function preMain(){
       
    setPlotType(PLOTTYPE_HISTOGRAM);//set the plot to histogram
    }
    var 
    xRawtime null;//declare global variable
    function main(){
        if(
    xRawtime==nullxRawtime rawtime();//initialize global variable 
        
    if(xRawtime.getValue(-1)==null) return;//null check on timestamp value of the prior bar
        
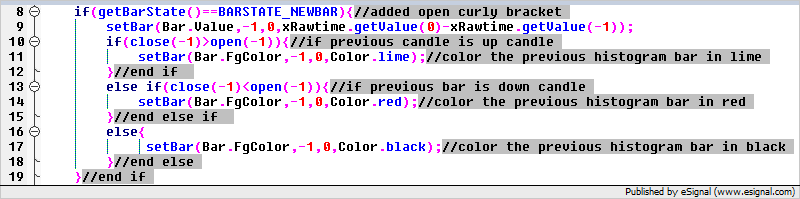
    if(getBarState()==BARSTATE_NEWBAR)//on the first tick of each new bar
            
    setBar(Bar.Value,-1,0,xRawtime.getValue(0)-xRawtime.getValue(-1));//calculate the difference between 
                                                        //timestamp values and assign it to the previous bar


    Originally posted by daniel1026
    I am using tick charts and need to put a Time Histogram as an indicator window at the bottom of the Chart.
    Does anyone know how to do this??
    Thanks...Daniel Sternthal

    Comment


    • #3
      Time Histogram

      Thanks much Alexis;
      Exactly what I was looking for.
      Is there a way to color code the Time Histogram Bars to equal the Price candles; i.e. Green Bar for an up-move in Price, Red Bar for a down-move in Price??
      Daniel
      Last edited by daniel1026; 01-23-2010, 09:12 AM.

      Comment


      • #4
        Daniel
        To accomplish what you want you need to replace the following section in the code example I provided earlier


        With the following


        Once you implement these changes the histogram bars will be colored depending if the candle closes up, down or unchanged
        Alex


        Originally posted by daniel1026
        Thanks much Alexis;
        Exactly what I was looking for.
        Is there a way to color code the Time Histogram Bars to equal the Price candles; i.e. Green Bar for an up-move in Price, Red Bar for a down-move in Price??
        Daniel

        Comment


        • #5
          Time Bar with Moving Average

          Is there a way to add a moving average to this formula of time bar? I tried but my knowlege is still limited.

          Thank you for the great job.

          Comment

          Working...
          X