 Tweet
Tweet
Hi all,
I'm hoping someone here can help. I recently changed from QCharts to ESignal because I needed ESignal for a proprietary oscillator I am using. In transferring, I tried to duplicate the studies that I was using in QCharts.
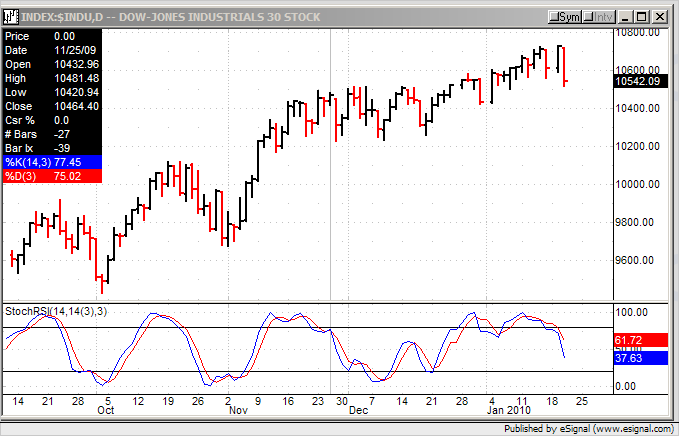
My problem is that the StochRSI study in QCharts is a fully adjustable study using two oscillators with the ability to adjust the length and smoothing of both the %D and %K functions.
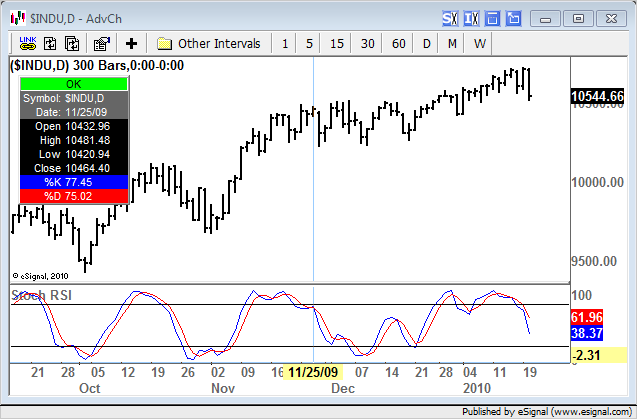
The only one I see available via the file sharing page "StochofRSI" does not allow for setting the smoothing of %D giving on a true/false button rather than a dynamic ability.
The QCharts GUI allows for customizing the display of the oscillators including the color and width of each while the ESignal formula does not. I can't get it to do what I need.
I would like to get the QCharts formula and possibly gui selections. I am not savvy enough to figure how to do this on my own. Hopefully one of you can help.
Thanks.
Thanks
I'm hoping someone here can help. I recently changed from QCharts to ESignal because I needed ESignal for a proprietary oscillator I am using. In transferring, I tried to duplicate the studies that I was using in QCharts.
My problem is that the StochRSI study in QCharts is a fully adjustable study using two oscillators with the ability to adjust the length and smoothing of both the %D and %K functions.
The only one I see available via the file sharing page "StochofRSI" does not allow for setting the smoothing of %D giving on a true/false button rather than a dynamic ability.
The QCharts GUI allows for customizing the display of the oscillators including the color and width of each while the ESignal formula does not. I can't get it to do what I need.
I would like to get the QCharts formula and possibly gui selections. I am not savvy enough to figure how to do this on my own. Hopefully one of you can help.
Thanks.
Thanks
Comment