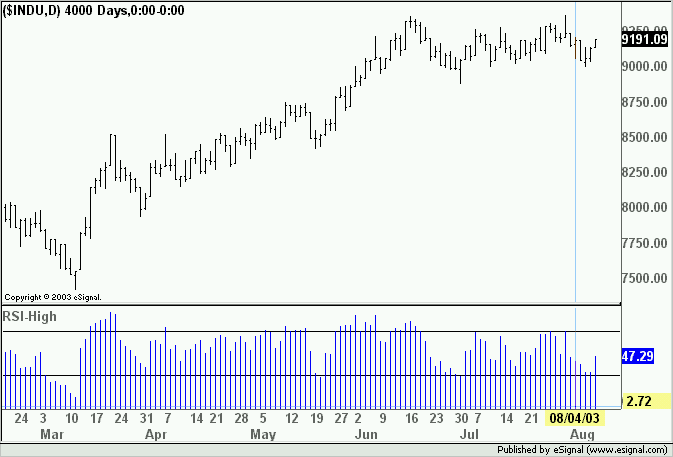
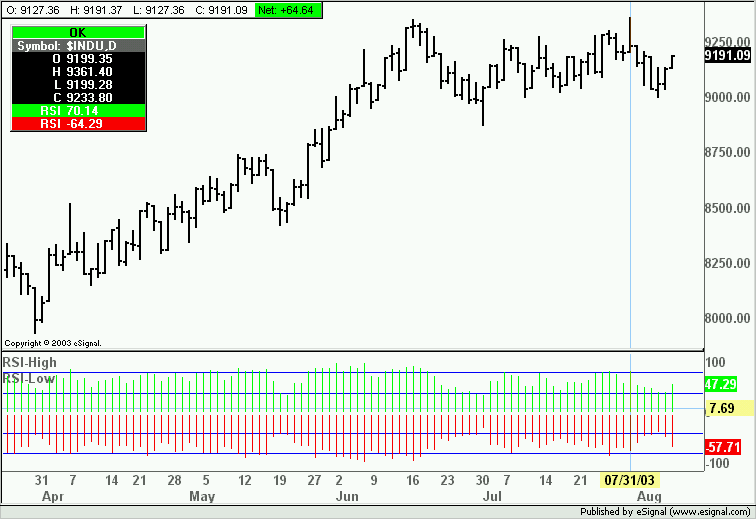
I like to be able to create an RSI displayed as follows:
1. as a Histogram
2. based upon a 6 period
3. and based upon the Highs
4. and with a 0 base (bars above the base line)
I'd also like to have the same thing done....
based upon the Lows (but bars below the base line).
If possible could I have one done with both in the same indicator with the highs above the base line and the lows below the base line (reversed).
Any help would be appreciated.
Bruce


Comment