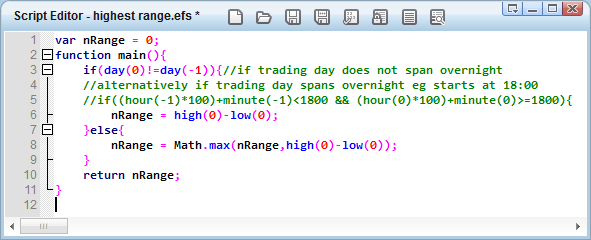
I am using the following to keep track of the highest range of a specific period. I am currently using a fixed period of 70, but I would like to return the highest range of the trading day. To do this, I would like to change this from a fixed number to 'bars since first bar of day' is there an easy way to code this in esignal? ( I use this in other software but Im not familiar with coding in esignal)>
Thanks,
Thanks,
Code:
var ddeAHH=null;
var AHH=null;
var veMA=null;
var avg=null


function preMain() {

    setStudyTitle("Highest High Range");
    setCursorLabelName("Range", 0);
    setCursorLabelName("Average", 1);
    setPlotType(PLOTTYPE_HISTOGRAM, 0);
    setDefaultBarFgColor(Color.blue, 0);
    setDefaultBarFgColor(Color.red, 1);


}

function main() {

 AHH = efsInternal("HHH"); //this line calls the function "range" and creates a series
     veMA = highest(70,AHH); //the series is used as an input to the builtin study

     avg = veMA.getValue(0)

    if (ddeAHH == null) {
        var sName = "AHH" + getSymbol() + getInterval();
        sName = sName.replace(/\$/g, ""); // remove $ from string
        sName = sName.replace(/\#/g, ""); // remove # from string
        sName = sName.replace(/\-/g, "");
        sName = sName.replace(/\(/g, "");
        sName = sName.replace(/\)/g, "");
        sName = sName.replace(/\ /g, "_") // replace space with underscore
        debugPrintln("DDE Link for Excel =eSignal|EFS!"+sName);
        ddeAHH = new DDEOutput(sName);
    }
        ddeAHH.set(avg);

        return avg;

}


var DClose = null;
var Highest= null;

//this is the separate function that calculates the range
function HHH() {


            Highest = Math.abs(high(0) - low(0));


    return Highest;


}

Comment