 Tweet
Tweet
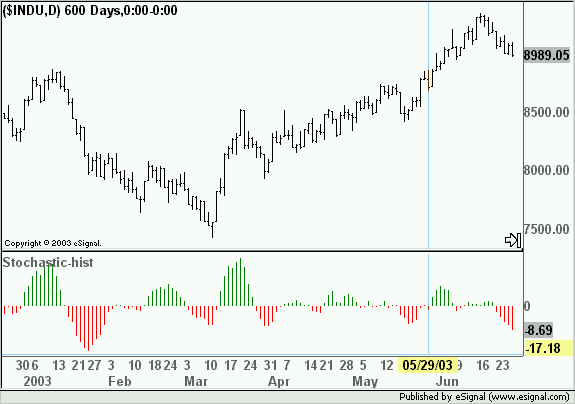
Looking for a stochastic 21/8/4 with a histogram green/red centered at the 50 line, similar to a MACD with histogram. Thanks. Mike
-
-
mplogos
The attached efs should do what you asked
All parameters can be modified using Edit Studies
Alex

-
Stoch Osc
Thanks, however I would like the histogram to represent %K and %D crossovers.
Thanks again for your help.
MikeComment
-
Mike
In that case the histogram would be centered at 0.
Here is the revised efs that plots the difference between %K and %D as a histogram.
If you open the efs with the Editor and compare it to the prior formula you will notice that it essentially uses the same components albeit moved around a bit (the old parts are commented out).
Alex
 Last edited by ACM; 09-09-2003, 08:32 PM.
Comment
-
Alexis,
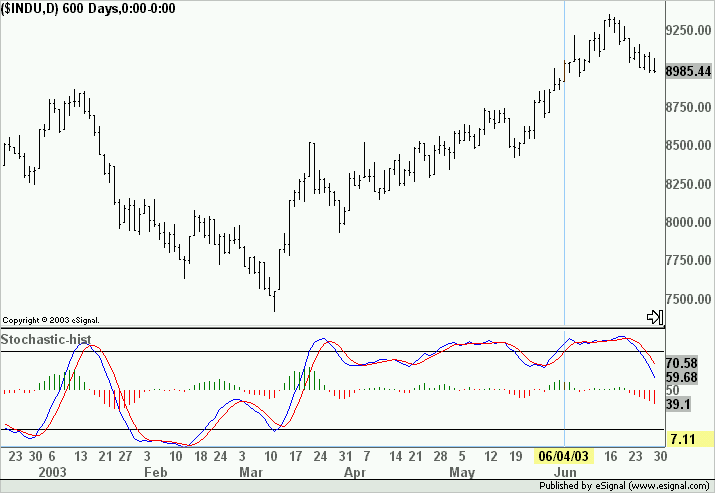
Ideally I would like to see the %K and %D lines with an overlay of the green/red histogram (ie. MACD lines with histogram overlay). I know Stochastics is a bounded study with a 50 center line so the histogram should also have upper and lower limits so it displays at the 50 center line. I have set limits on the efs you sent (same as the one in the efs oscillator library) and the histogram bars stay on the page well. Just need the %K and %D overlay to go with it. Merging two separate studies of histogram efs. and %K -%D doesn't work. Thanks,
MikeComment
-
Mike
Merging two separate studies of histogram efs. and %K -%D doesn't work
That is because the base for the histogram is set to 0 as I said in my prior message so if you simply overlay the two studies the histogram will be at the bottom of the indicator pane irrespective of the fact that the Stochastic study is centered at 50.
In order to center the histogram at 50 you need to add that value to the difference between %K and %D.
The attached efs will plot both the Stochastic and the histogram of the adjusted difference between %K and %D as one indicator
Alex
Comment
Comment