Hi,
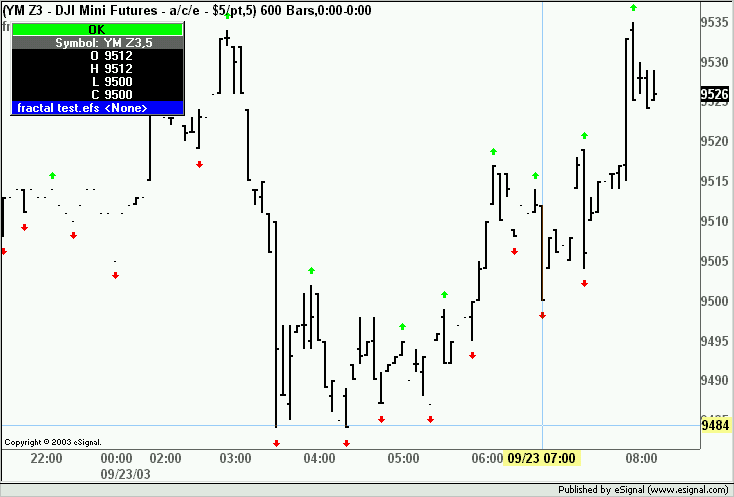
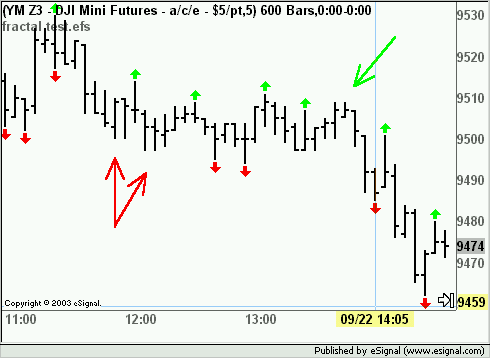
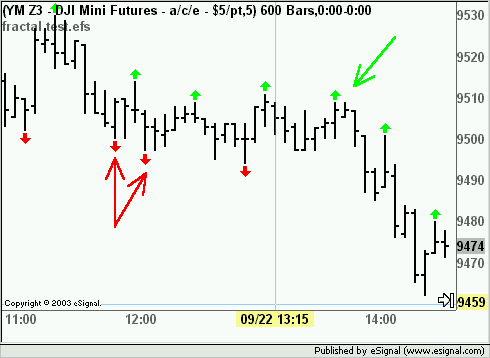
Could someone please help me out with the following formula so that I can identify fractal formations on my charts? The definition of a fractal is as follows:
A fractal must have two preceding and two following bars with lower highs ( higher lows in a down move). In a buy fractal, we are interested only in the bars' high. In a sell fractal, we are interested only in the bars' low. This is a five or more bar sequence where the center bar (or group of bars) is preceded and followed by two lower bar HIGHS for LONG signals OR, Two higher LOWS for SHORT signals.
I need to have a green up arrow or upward triangle just above the center bar or bars for a buy fractal, and a red down arrow or downward triangle below the center bar or bars for a sell fractal.
Thank you for your help, and let me know if this is enough information to do what I need to do. I appreciate all the help!
Troy


Comment