 Tweet
Tweet
Hello,
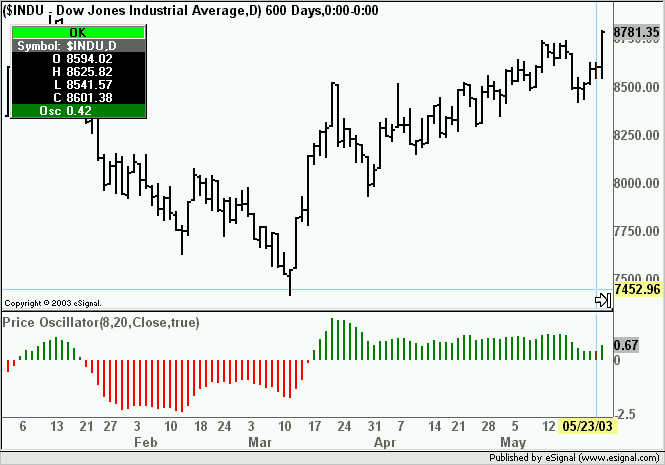
I'm trying to get an ema price histogram that shows red bars when in moves below zero and lime when above.
The values are 8ema and 20ema.
Your help would be much appriciated.
I'm trying to get an ema price histogram that shows red bars when in moves below zero and lime when above.
The values are 8ema and 20ema.
Your help would be much appriciated.
Comment