Announcement

Collapse
No announcement yet.

Background colors

Collapse
X
 
  • Filter
  • Time
  • Show
Clear All
new posts

  • Background colors

    This is probably a very elementary question, but I'm programming challenged.

    What I want to do is make the background color of my $TICKQ chart green above zero, and red below zero.

    Similarly, I want the background color in $TRINQ to be green below 0.65, gray between .65 and .90 and red above .90.

    I've seen postings where people want the background colors to change, based on certain criteria. Not me.. I just want the background colors fixed, as above. I assume I can have two or three background colors?? If not, I could live with one (changing)background color only, based on the TICK / TRIN values above, but the fixed 2 or 3 colors is my preference.

    Is this easily done? Thanks in advance.
  • #2
    setBarBgColor()

    setBarBgColor( Color )


    ยท Color: A valid color definition or RGB value.

    Sets the background color for the current bar.

    setBarBgColor( Color.blue );

    is what you want to use.

    if(close(0, -1, "$tickq">=0)
    setBarBgColor( Color.green);

    etc

    Comment


    • #3
      David, I can't say I understand those commands completely (yet), but it seems like the background color is being set based on the closing value of the latest bar? So the whole background color of the chart would change, if TRINQ changed from .89 (gray) to .91 (red)?

      Do you know, can the background color be split? Thanks

      Comment


      • #4
        shaeffer

        When a condition is met (ie for example close>0) you can do the following with regards to background colors

        a) paint the background of the whole chart in one color
        b) paint the whole background (ie top to bottom of chart) of the individual bar that meets the condition in one collor
        c) paint only a portion of the background of the individual bar that meets the condition in one color (the portion to be painted is user definable)
        You cannot paint at the same time (ie on the same bar) the background of the chart or of the individual bar in two colors.

        In his formula David is using option b) described above.

        Alex

        Comment


        • #5
          Thanks for the reply Alex, that's useful info if I 'must' have the background color tied to a condition of the last bar.

          But my preference is to fix the background colors independent of any bar value. So that in the case of $TICKQ, I would always see green background (above zero) and always see red background (below zero). So throughout the day I would see the background in two colors, regardless of last bar value (unless the intraday Tick rose so high that the zero line sank below my window view, and then all I'd see is green background).

          Can fixing the background colors like this be done? Or, if I want more than one background color, does that have to be associated with a last bar value?

          Comment


          • #6
            shaeffer
            In general you cannot paint the background of the chart OR of an individual bar in more than one color irrespective of conditions.
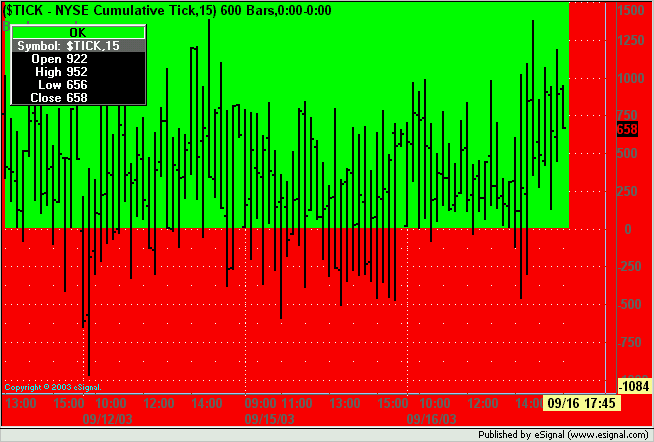
            However, this is what can be done. The enclosed efs will set the background of the chart to red (you could also do that using Chart Properties) and then sets an "always true condition (ie 1=1) and paints in green the background of the individual bar starting from 0 upwards.


            The result is that - so long as there is a bar - the portion of the chart from 0 upwards will be painted in green.
            As far as I can see though you will not be able to implement your 3-color solution. With $TRINQ you will just need to set a threshold other than 0.
            The level at which the bar begins being painted in green can be modified in Edit Studies and is set by default to 0.
            Alex

            PHP Code:
            function preMain(){
            setPriceStudy(true); 
            setStudyTitle("Background"); 
            setShowCursorLabel(false); 

            var 
            fp1 = new FunctionParameter("Threshold"FunctionParameter.NUMBER);
                
            fp1.setDefault(0);

            }

            function 
            main(Threshold){

            if (
            1==1) {
            setChartBG(Color.red); 
            setBarBgColor(Color.lime,0,Threshold,99999);
            }

            return 
            null;

            Comment


            • #7
              shaeffer
              Thinking a bit outside of the box and taking advantage of the study overlay available in version 7.5 it is actually possible to have a multi colored background.
              In the same chart in which you are running the efs posted earlier you would also run the following efs.

              PHP Code:
              function preMain(){
              setPriceStudy(false); 
              setStudyTitle("Background"); 
              setShowCursorLabel(false); 
              setStudyMin(-250);
              setStudyMax(250);

              }

              function 
              main(){

              if (
              1==1) {
              setBarFgColor(Color.lightgrey);
              setBarBgColor(Color.lightgrey,0,-250,250);
              }

              return 
              0;

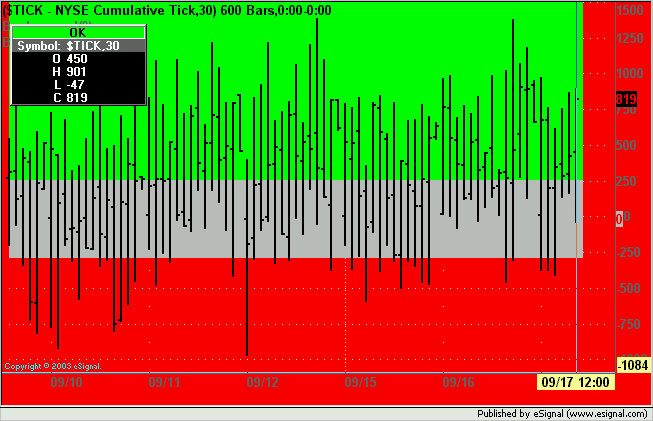
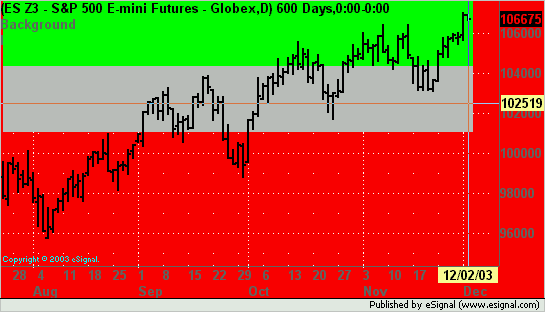
              This will open an indicator pane which can now be overlayed in the price pane thereby creating the result shown in the following image.


              The two efs will need some tidying up and adjustments to adapt them to the $TRINQ values but that should not be too difficult.
              Again this is possible to achieve only with version 7.5 that is currently in beta.
              Alex

              Comment


              • #8
                Thanks Alex, with 7.4, I'll do a little studying to understand how to even import(?) an EFS (I've never used one before, but I see there are tutorials on the site). If I run into any problems, there will likely be someone at the Adv GET seminar this Sat in SF that could help me out.

                Then I'll be ready for when 7.5 comes out.

                Thanks again
                Shaeffer
                Last edited by shaeffer; 09-17-2003, 01:34 PM.

                Comment


                • #9
                  is there a way to use one axis for both studies? or to synchronize the axes?
                  I tried the example below on a es #f chart and could not manage to display the values of the overlayed study at the correct position, because it uses it's own axis.

                  Comment


                  • #10
                    docarzt
                    The only way I can achieve that is by forcing both the price window and the "indicator" window to the same values using setStudyMax and setStudyMin.
                    Once overlayed the result is what shown in the image below where even if you scroll the y-axis remains synced.
                    Alex

                    Comment


                    • #11
                      Did anyone ever come up with a solution to this post?

                      Fibbgann
                      Excellent book on JavaScript for beginners

                      Comment


                      • #12
                        Here was what I was able to puy together. My question is how can one get the addLineTool to draw a line over the top of the setBgColor?
                        Attached Files
                        Excellent book on JavaScript for beginners

                        Comment


                        • #13
                          FibbGann
                          Right click chart, select Properties and put a check mark in Draw Lines On Top of Price
                          Alex

                          Comment


                          • #14
                            Ahhh the simple things.

                            Thanks,

                            Alex
                            Excellent book on JavaScript for beginners

                            Comment


                            • #15
                              Did anyone ever come up with a solution to this post?

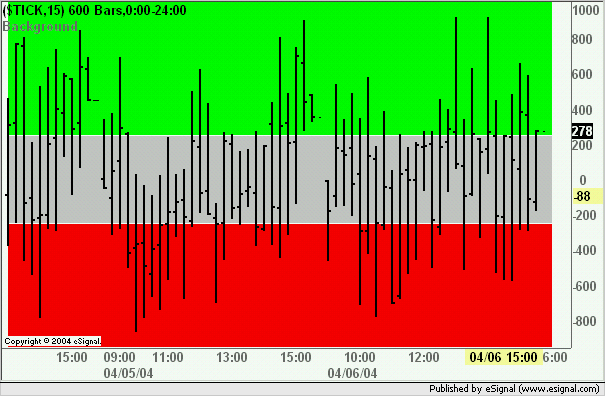
                              There actually is a solution to having multiple colored backgrounds on the same bar. The setBarBgColor can also address the data series besides painting in between values.
                              The command is as follows setBarBgColor(Color, [series], [lowvalue], [highvalue])
                              Enclosed below is an example
                              Alex

                              PHP Code:
                              function preMain(){
                              setPriceStudy(true); 
                              setStudyTitle("Background"); 
                              setShowCursorLabel(false); 

                              }

                              function 
                              main(){

                              var 
                              vValue1 250;
                              var 
                              vValue2 0;
                              var 
                              vValue3 = -250;

                              setBarBgColor(Color.lime,0,250,null);
                              setBarBgColor(Color.lightgrey,1,-250,250);
                              setBarBgColor(Color.red,2,null,-250);

                              return new Array (
                              vValue1+"",vValue2+"",vValue3+"");

                              Comment

                              Working...
                              X