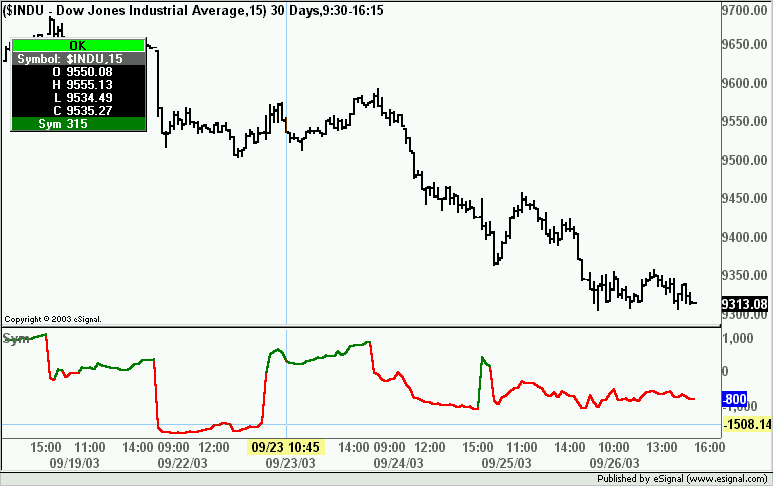
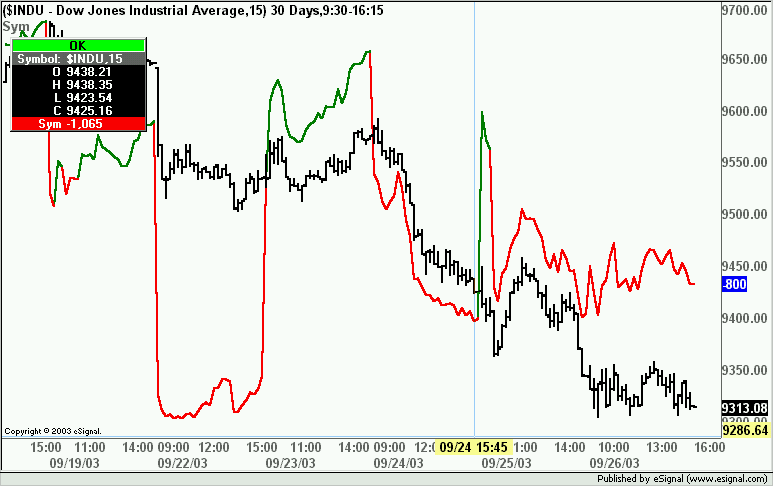
I would like to plot these symbols as lines on intraday bases in an efs. with the true value indicated in the axis. If possible I would like the line to be able to change colors as it crosses the median of "0" . I can change the colors and symbols in the editor just not good at setting the code for this efs.
I have looked at other posts, but they were not very clear.
Any help here, would be greatly appreciated!
Thanks,
Realm
I have looked at other posts, but they were not very clear.
Any help here, would be greatly appreciated!
Thanks,
Realm


Comment