Announcement

Collapse
No announcement yet.

Spread charts of yield

Collapse
X
 
  • Filter
  • Time
  • Show
Clear All
new posts

  • Spread charts of yield

    http://www.elitetrader.com/vb/showth...944#post341944

    asks

    10-01-03 04:38 PM
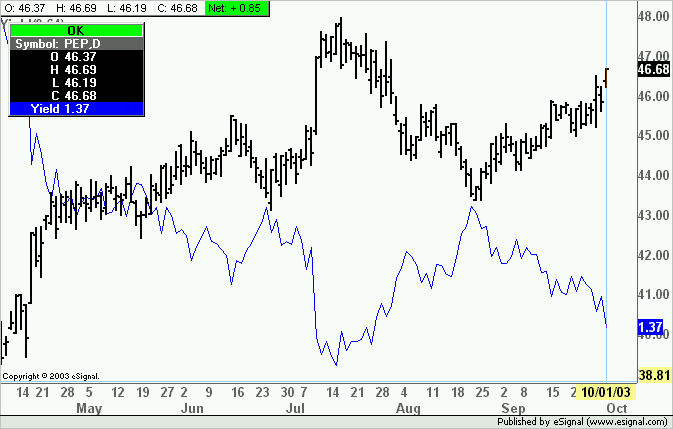
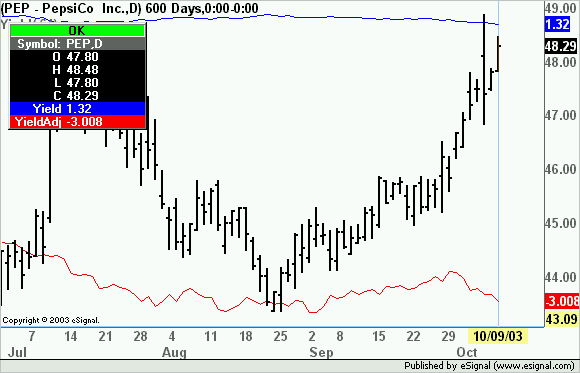
    Can esignal chart a yield?
    example- Pepsi pays a dividend of .64 a year. In qcharts you would put .64 / pep in the symbol field and you'd have a chart of the yield. I can't figure out how to do this in esignal, is it possible?

    I downloaded the 7.5 beta today and it doesn't look like you can put whole numbers into spread charts yet, is that coming?

    Thanks

  • #2
    David
    One way would be to do it with an efs and then overlay it on the chart.
    Alex


    PHP Code:
    function preMain() {
        
    setPriceStudy(false);
        
    setStudyTitle("Yield");
        
    setCursorLabelName("Yield");
        
        var 
    fp1 = new FunctionParameter("Value"FunctionParameter.NUMBER);
        
    fp1.setLowerLimit(0);        
        
    fp1.setDefault(1);
        
              
    }
    function 
    main(Value) {

    var 
    vYield= (Value/close())*100;


    return 
    vYield;

    Last edited by ACM; 10-01-2003, 03:08 PM.

    Comment


    • #3
      Great!!!
      I've been wanting to do a chart like this for awhile. How would you accomodate multiple dividends? ie. many companies pay Quarterly (some even monthly). Does eSignal have the dividend history or do we need to find that elsewhere?

      Comment


      • #4
        pj909
        You could do it by setting conditions with dates ie something like "if the date is equal or less than x then use value 1 in the calculation of the yield, if it is equal or less than y and greater than x then use value 2 and so on.
        As to your question regarding the dividend history I don't know if eSignal has it.
        Alex

        Comment


        • #5
          Thank you, the script below works well. Now what I'd like to do is create another efs that plots the yield of a stock vs. the ten year treasury (symbol $tnx). It should be pretty easy, but I have no clue how to program.

          All you'd have to do is take the output of this formula and subtract the symbol $tnx

          var vYield= (Value/close())*100;

          Also, how do I get it to overlay on a price chart, I can only get it to display in a seperate pane.

          Thanks a bunch

          Comment


          • #6
            lescor
            I think the enclosed formula does what you asked.
            It will plot both the yield and the "adjusted" yield.
            As to overlaying the study once you have loaded it in the chart click and drag the indicator window onto the price window while keeping the <Shift> key pressed. However to maintain the appropriate scale you will need beta 7.5.
            Alex


            PHP Code:
            function preMain() {
                
            setPriceStudy(false);
                
            setStudyTitle("Yield");
                
            setCursorLabelName("Yield",0);
                
            setCursorLabelName("YieldAdj",1);
                
            setDefaultBarFgColor(Color.blue,0);
                
            setDefaultBarFgColor(Color.red,1);
                
                var 
            fp1 = new FunctionParameter("Value"FunctionParameter.NUMBER);
                
            fp1.setLowerLimit(0);        
                
            fp1.setDefault(1);
                
                      
            }
            function 
            main(Value) {

            var 
            vYield = (Value/close())*100;
            var 
            vYieldAdj= ((Value/close())*100)-getValue("close",0,-1,"$TNX");


            return new Array (
            vYield,vYieldAdj);

            Comment

            Working...
            X