Announcement

Collapse
No announcement yet.

HELP! - tripple screen system on esignal

Collapse
X
 
  • Filter
  • Time
  • Show
Clear All
new posts

  • HELP! - tripple screen system on esignal

    This situation is my problem:
    I have three charts of the same instrument but in three different intervals: 60, 15 and 1 minute. On each I have formula which gives me the signal to buy or sell. Ofcourse mostly these formulas give me different signals but sometimes all of them are the same. for example all three formulas give me signal to buy. What I want to do is to write the formula which will give me a signal to buy or sell only if all three signals from the charts will be the same (all three will give signal to buy or sell). Its very important to me because I would like to automatickly test this kind of formula. Maybe there is other way to do it. I dont have clue how to do it.
    Please help me.
    thank you.
  • #2
    mateusz,

    There are only two ways to do this currently. Neither is elagent.
    One uses Universal Globals (ie: setGlobalValue and getGlobalValue). This is the easiest way, and in it you would set the state (Long/Short) of the higher interval formulas (using setGlobalValue) and on the shorter interval chart you would read the state of the higher interval chart (getGlobalValue).

    This has two drawbacks. One is that it would be impossible to backtest this solution (at least using the backtester. You could always do your own simple backtesting by recording the trades in a CSV file and uploading the trade info into Excel and doing whaterevr type of math on that data). The other drawback is that there is no way to know on a tick by tick basis which of the three formula's would run first. In your specific case this isn't too bad, as long as you run the EFS doing the getGlobalValue() on the lowest interval chart.

    The other way is to use file I/O to accomplish the same task, and it has the same drawbacks as stated above.

    There is something in the works to make this all much easier, but it may not be here for a while.

    Garth
    Garth

    Comment


    • #3
      Solution....

      First....

      Esignal does not really provide for this type of backtesting (using data from three different charts and three different sets of indicators).

      But... There is a solution...

      The best (and easiest) way to accomplish this is to use the FILE routines to have your system record the data from your three unique systems into files. Once this is done, you would write a routine to OPEN and MATCH data from all three files for trade executions.

      For example, your individual EFS files should be capable of writing the DATE/TIME and SYSTEM RESULTS to a unique file name for each of your three charts..

      For one of your files, you might include the following code (after your code completes it's system calculations - when it is ready to record the information..

      PHP Code:
      var = new File("System1Out.txt");

      function 
      preMain() {


        if(
      f.exists()) {   //  Empty the file
          
      f.open("wt");
          
      f.writeln("");
          
      f.close();
        }
      }


      function 
      main() {
      //  run you calculations..


      //  record your info to a file.
         
      var line ""+getValue("rawtime")+","+YourValue;
         
      f.open("at");
            
      line f.writeln(line);                      
         
      f.close();  

      In this case, rawtime is used to identify the unique date/time for each bar. YourValue should be represented as something like..

      0 = neutral
      1 = BUY
      -1 = SELL

      When you reload these files (after the markets close), they will create the files necessary for historical backtesting (historical results of your systems trading logic). Now, we need to create an EFS file that can load all three and match up the dates - to issue "back-test" signals in esignal..

      Here we go..


      PHP Code:
      var f1 = new File("System1Out.txt");
      var 
      f2 = new File("System2Out.txt");
      var 
      f2 = new File("System3Out.txt");

      function 
      preMain() {

      }


      function 
      main() {

      var 
      System1Trigger 0;
      var 
      System2Trigger 0;
      var 
      System3Trigger 0;

      var 
      CurrentBarTime getValue("rawtime");


      //  Open file #1 and retrieve the value of YOUR SYSTEM for the current bar.
         
      var line;
         
      varPosCount;
         
      f1.open("rt");
          while(!
      f1.eof()) {  
            
      line f1.readln(line);       
            if (
      line) {
              
      PosCount line.split(",");          
              if (( 
      parseFloat(PosCount[0]) > 0) &&
                  (
      parseFloat(PosCount[0])  == CurrentBarTime )) {    
                   
      //  valid date value that matches our current bar time
                  
      System1Trigger parseFloat(PosCount[1]);
              }
            }
          }
         
      f1.close();  

      //  Open file #2 and retrieve the value of YOUR SYSTEM for the current bar.
         
      var line;
         
      varPosCount;
         
      f2.open("rt");
          while(!
      f2.eof()) {  
            
      line f2.readln(line);       
            if (
      line) {
              
      PosCount line.split(",");          
              if (( 
      parseFloat(PosCount[0]) > 0) &&
                  (
      parseFloat(PosCount[0])  == CurrentBarTime )) {    
                   
      //  valid date value that matches our current bar time
                  
      System2Trigger parseFloat(PosCount[1]);
              }
            }
          }
         
      f2.close();  

      //  Open file #3 and retrieve the value of YOUR SYSTEM for the current bar.
         
      var line;
         
      varPosCount;
         
      f3.open("rt");
          while(!
      f3.eof()) {  
            
      line f3.readln(line);       
            if (
      line) {
              
      PosCount line.split(",");          
              if (( 
      parseFloat(PosCount[0]) > 0) &&
                  (
      parseFloat(PosCount[0])  == CurrentBarTime )) {    
                   
      //  valid date value that matches our current bar time
                  
      System3Trigger parseFloat(PosCount[1]);
              }
            }
          }
         
      f3.close();  

      //  At this point, your three System#Trigger variables have been read and match for the current bar, so it is simply a matter of executing the trades..

        
      if ((!Strategy.isLong) &&
            (
      System1Trigger == 1) &&
            (
      System2Trigger == 1) &&
            (
      System3Trigger == 1)) {
            
      Strategy.doLong("Long Trade"Strategy.MARKETStrategy.NEXTBARStrategy.DEFAULT);
         }
        if ((!
      Strategy.isShort) &&
            (
      System1Trigger == -1) &&
            (
      System2Trigger == -1) &&
            (
      System3Trigger == -1)) {
            
      Strategy.doShort("Short Trade"Strategy.MARKETStrategy.NEXTBARStrategy.DEFAULT);
         }


      Wow, that was alot of work...

      I have not tested this, but it gives you a good working example to start with. I have done stuff like this before. There are a few tricks to speeding up the process, but this will work.

      Really long test may take some time though because you are doing alot of file access. If you want to test, try it with a few days (2~3) until you see it working, then start adding days at about +5 each time you run longer tests.

      Hope this helps.

      Brad
      Brad Matheny
      eSignal Solution Provider since 2000

      Comment


      • #4
        Brad,

        Nice solution, yours is more elegant than mine. I had been downloading multiple timeframes into files and using a third party software to analyze the data in the files, with the results being qualitative and not quantitative, not to mention extremely time consuming.

        Thanks!

        Comment


        • #5
          If anyone is interested here is an alternative use of Brad's file I/O method (the relevant code is lifted directly off his example).
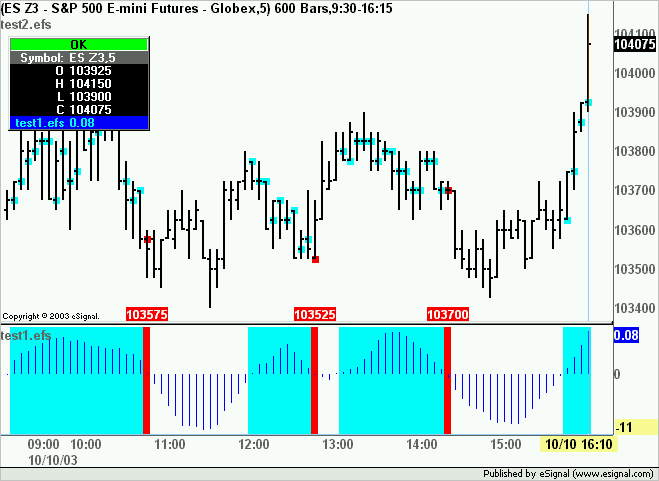
          In this example the output of the file is used to plot shapes or text on the price pane of the same chart and on a chart for a different symbol.

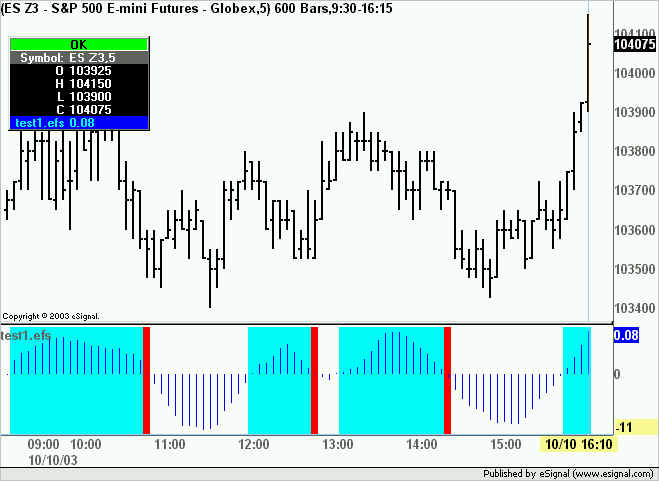
          The first efs attached to this message calculates a simple Oscillator, paints the background cyan if the Oscillator is above 0 and paints the background of the first bar that goes below 0 in red.
          It also sets a distinct flag for each of the conditions and outputs those to a file.
          Alex

          Attached Files

          Comment


          • #6
            The efs attached here uses the flags set by the prior efs to plot shapes and text on the price pane.
            Notice that there are no conditions set in this efs other than verifying the status of the flag in the ouput text file generated by the other efs.


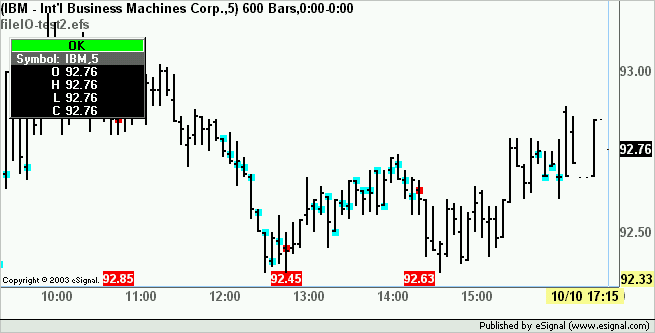
            Also here is the result of the same efs run on a chart with a different symbol (same interval). As you can see the shapes and text are perfectly time aligned to those of the other chart even though the time templates used are different.
            Alex

            Attached Files

            Comment


            • #7
              Great job Alex...

              It is great to see Alex's use of my file I/O routines. Actually he hits on a very important point...

              "this type of routine can be used for many different types of features". Here are just a few...

              1. Back-testing
              2. Graphics functions between chart/indicators (as Alex has shown).
              3. Indicator Filters (filter one time frame using indicators and trade another).
              4. Compliation of specialized indicators (from multiple charts).
              5. Compilation of specialized MA of specific values (one could read N recent values from this file and then average them or run some other function).

              I could probably think of a few others, but don't have the "brain capacity" this morning..

              Alex, great work. Did you find any issues when working with these files you feel are necessary to disclose??

              Brad
              Brad Matheny
              eSignal Solution Provider since 2000

              Comment


              • #8
                Hi,

                I have been checking this efs modified by Alex, and I was wondering if someone could let me know I this routine can be used to:

                3. Indicator Filters (filter one time frame using indicators and trade another).
                4. Compliation of specialized indicators (from multiple charts).

                Cheers

                Carlton

                Comment

                Working...
                X