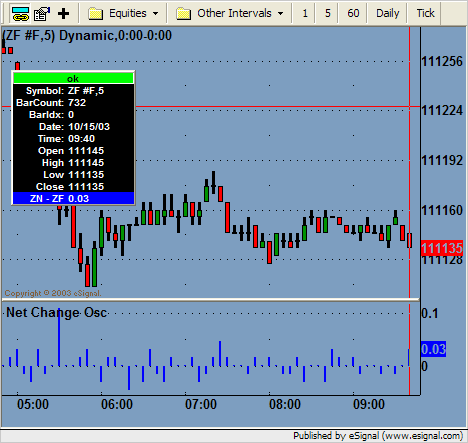
I am trying to chart the FYT chart using net change. example: IF the 5 years are up 10 ticks and the 10 year is up 8 ticks the chart would read 2 (10-8). How do you chart based on net change not close?
Announcement
Collapse
No announcement yet.
NET CHANGE CHART example:FYT chart (5 yr treasury - 10 yr. treasury)
Collapse
X
-
Hello twator,
The formula below might be what you need. If not, it will give you a good code example of how to get the net change values. Try it out and let me know if this helps.
Osc2SymNetChange.efs
 Jason K.
Project Manager
eSignal - an Interactive Data company
EFS KnowledgeBase
JavaScript for EFS Video Series
EFS Beginner Tutorial Series
EFS Glossary
Custom EFS Development Policy
New User Orientation
-
Hi Jason,
Is there anyway to actually chart this net change as a bar chart or candlestick chart instead of an oscillator? I've been trying to get this figured out for about a week now, and finally came across something that resembles what I need.
I need to chart a spread as the example given with the zf-zn, however I also need to ratio my symbols ie. (2*msft) - dell. But, Im trying to ratio them, and chart them by the 'Net Change' as in the given example.
Any ideas?
Comment
-
Hello Stockodds,
Creating bar or candlestick plots of a net change value isn't possible on a historical basis. When the study loads (or is reloaded) there is only one value per bar on each historical bar as the study computes on completed bars only. Therefore the OHLC values needed to create a bar or candlestick would all be the same value. You could collect the OHLC data in real time on a tick-by-tick basis to create something that resembles a bar or candlestick using a couple drawLineRelative() lines. You would collect the OHLC values in some global variables (declared outside main()) and then use the high and low to draw the wick. Right after that you would use the open and close (or last) values to draw the body. Make the body a slightly thicker line. To see a code example of this process in action check out the eSignal_HeikinAshi.efs study.
For creating net change calculations please review the following thread.
Spread Translations into EFS
In the following thread where you asked a similar question, Alex provided you a code example of this as well.
Formula Conversion.
If you are having some trouble getting this to work please post the code you are working with as an attachment and I will help guide you through any problems you may be encountering.Jason K.
Project Manager
eSignal - an Interactive Data company
EFS KnowledgeBase
JavaScript for EFS Video Series
EFS Beginner Tutorial Series
EFS Glossary
Custom EFS Development Policy
New User Orientation
Comment
Comment