Announcement

Collapse
No announcement yet.

MACD with zones

Collapse
X
 
  • Filter
  • Time
  • Show
Clear All
new posts

  • MACD with zones

    Is there a study out there for the MACD (7,40,1) that I can put zone lines in (don't need the 0 line).

    Bruce

  • #2
    Or it is possible to have the MACD change colors when above the 0 line (Blue) and when below the 0 line (Red).

    Actually, above .02 (blue) and below -.02 (red).

    Thanks again.

    Bruce

    Comment


    • #3
      Bruce
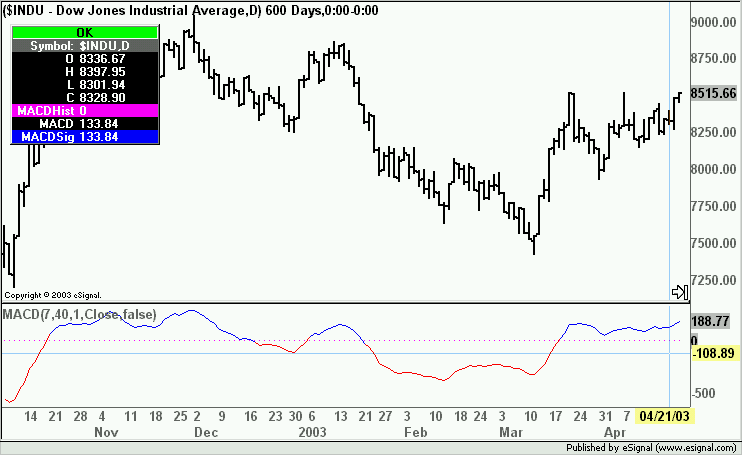
      With the settings 7,40,1 the MACD line will be the same as the Signal line.
      In the attached efs I have chosen to paint the Signal line as it is the last one to be returned (hence plotted on top). If you change settings and would rather have the MACD line painted substitute the ,2 in Lines 66 and 68 with ,1.
      All parameters can be modified using Edit Studies (default lengths are 7, 40, 1).
      Alex

      Attached Files

      Comment


      • #4
        Alex:

        Again you come to my aide.....thanks so much.

        It worked perfectly but is there a way to increase the width of the centerline....I'd like to make it much thicker.

        Bruce

        Comment


        • #5
          Bruce
          Actually the magenta centerline is the MACD Histogram which is plotting at 0 because the difference between MACD and Signal is 0 (due to the length of the Signal being set to 1).
          Irrespective if you want to make it thicker go to the preMain() section and change the setBarThickness(1,0) which is the default used by the Histogram plot. The first number is the value for the thickness and the second indicates which plot it relates to.
          Alex

          Comment

          Working...
          X