Announcement

Collapse
No announcement yet.

Linear Regression Bands Needed !!!

Collapse
X
 
  • Filter
  • Time
  • Show
Clear All
new posts

  • Linear Regression Bands Needed !!!

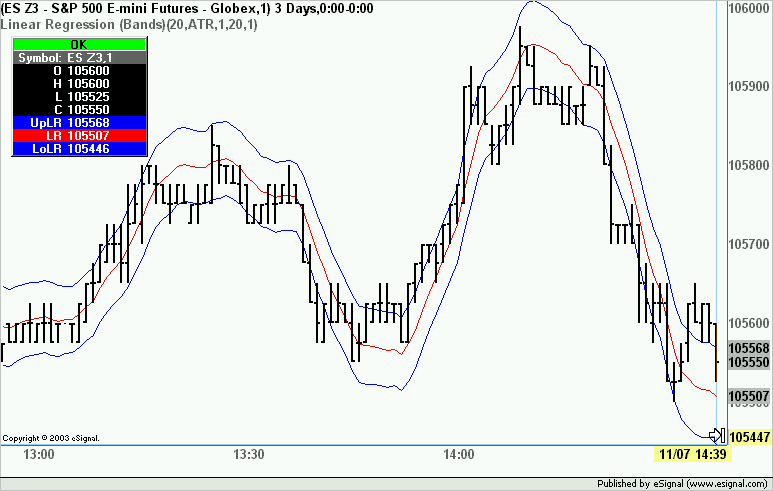
    eSignal offers the Linear Regression Lines and it would be most helpful if the "Linear Regression Bands" were also available.

    Unlike the lines which adjust based on the data each time a new bar is added, the bands plot the last value of the lines in a continuous manner in the same way a moving average or Bollinger Band plots the last calculated value.

    The benefit to having LinReg Bands is similar to Bollinger Bands without the built in self adjustment.

    If anyone already has this done, I'd be grateful for a copy.

    Thanks.
    OpaBert

  • #2
    OpaBert

    If I correctly understood your question you like to have a RTC that automatic afjust its direction and the STD .

    The EFS is alraedy done by ALEXIS MONTENEGRO and is fully configurable in therm of default STD and lenght

    GO TO ONE OF HIS GROUP IN FILESHARE and you'll find it under the name LinReg.efs

    Settings are default 64 bars and +/- 2 STD and you can change it at your pleasure going to edit study
    Fabrizio L. Jorio Fili

    Comment


    • #3
      OpaBert

      With regards to the LinReg.efs mentioned by Fabrizio, I would suggest using it only if you need to apply alerts or other actions to the Linear Regression Lines.
      Otherwise use the Linear Regression study available in Basic Studies which provides the exact same results (just change the Length to a number other than 0 which is the default and indicates all the data in the chart).

      If instead you are looking for a continuous Linear Regression then TS Support has recently posted an efs to compute that which is available here together with a complete set of Linear Regression Indicators
      Attached is a modification I did of that efs that adds bands calculated on either a fixed percent or point value or on the Average True Range depending on user selection. All the additions and modifications to the efs are documented in the script.
      The defaults for the Linear Regression length is 20 and for the bands is Average True Range of 20 periods (no multiplier) but all can be mnodified through Edit Studies.

      Alex

      Attached Files

      Comment


      • #4
        LinReg Bands almost there!

        Hi Alex,
        Thank you for your reply. The chart you show is what I'm looking for but not based on ATR. I actually do want the continuous bands to be a plot of the LinReg values and be able to use either Close, High, Low or other things like Pivot Points or MA's as the basis for the LinReg Bands. I'll take a look at the reference you gave to see if it does what I need. I am very new at using eSignal and need some guidance to add studies. thanks again.
        OpaBert

        Comment


        • #5
          Opabert
          If you want the Linear Regression to be calculated on a value other than close substitute close in this line of the formula with open, high or low
          sum += (i - (Length + 1) / 3) * close(i - Length);
          FWIW the Linear Regression is not based on ATR, only the bands are based on the ATR if that is the selected option.
          Alex

          Comment


          • #6
            Lost on LinReg Script

            Hi Alex,

            I looked at the TS info and unfortunately have no clue about what I was looking at.

            I know it must be easy for folks that know Java but I'm a grandpa and if it were Latin I might have a chance.

            Is there a number of someone at eSignal I could call that could offer more guidance? I know What I'm looking for would be possible with a little coaching.

            Thanks,
            OpaBert

            Comment


            • #7
              Working through LinReg

              Alex,

              You said,"Otherwise use the Linear Regression study available in Basic Studies which provides the exact same results (just change the Length to a number other than 0 which is the default and indicates all the data in the chart)." and

              "If you want the Linear Regression to be calculated on a value other than close substitute close in this line of the formula with open, high or low
              sum += (i - (Length + 1) / 3) * close(i - Length); "

              If I understand correctly, by changing the length from 0 to 1 it will only plot the last value rather than the entire "LinReg Line". But what do I change to make the plot continuous? Or is that it?

              Then I can substitute high, low, etc for close to base the bands on something else. That must be where you used ATR in your example, correct???

              So I use the wizard to bring up the basic LinReg, then make changes to the script and that should give me the bands???

              Am I on the right track?

              Thanks again,
              OpaBert

              Comment

              Working...
              X