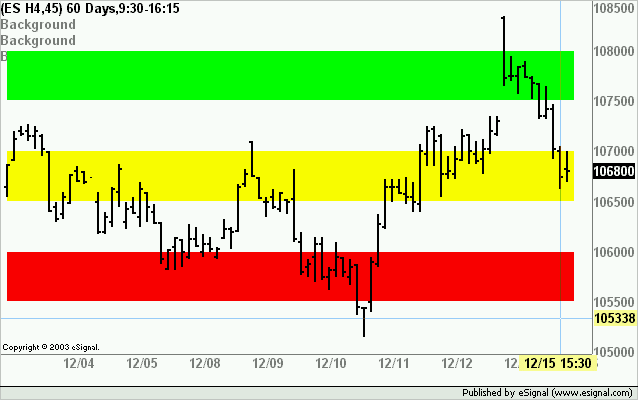
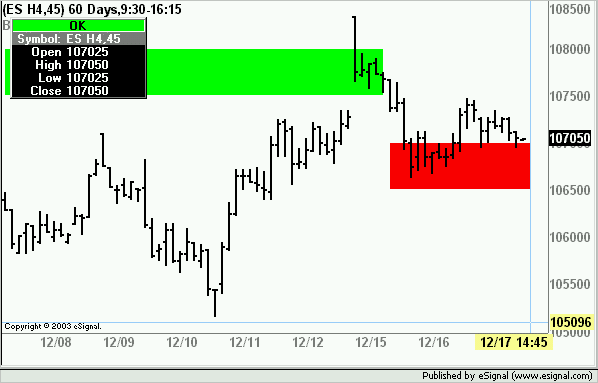
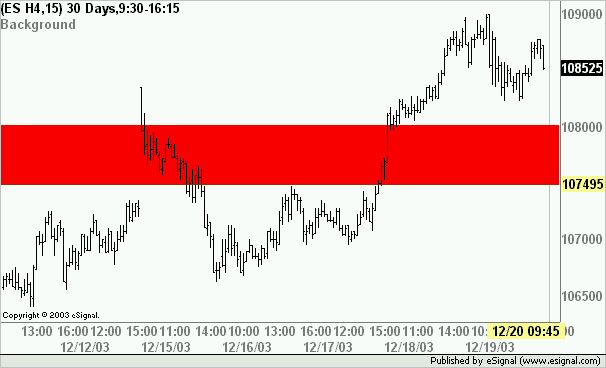
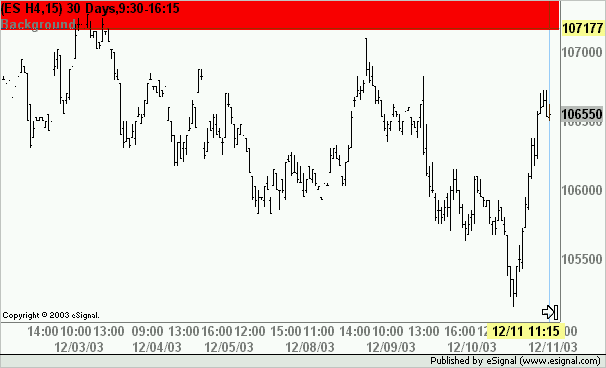
I'm looking for a script that will color the background in the price pane between two prices. The intended result is a horizontal band of background color beteen price A and B.
In total, the script should allow entry of 4 value ranges for support (Color 1 for support areas) (e.g. price A to B, C to D, E to F, G to H), and 4 value ranges for resistance (Color 2 for resistance areas) (e.g price I to J, K to L, M to N, O to P). Ideally, the 16 values making up the 8 ranges would be entered using Edit Studies > Formula Parameters.
Edit Studies > Formula Parameters labels (in this order):
R Level 4 Low Price High Price
R Level 3
R Level 2
R Level 1
S Level 1
S Level 2
S Level 3
S Level 4
I haven't seen horizontal background color changes in any script, but maybe it's possible to do. Thanks in advance for any help.


Comment