Announcement

Collapse
No announcement yet.

Long and Short Stop Formulas

Collapse
X
 
  • Filter
  • Time
  • Show
Clear All
new posts

  • Long and Short Stop Formulas

    I am trying to convert two simple formulas that i am using in metastock to the esignal formula language but am having little success.
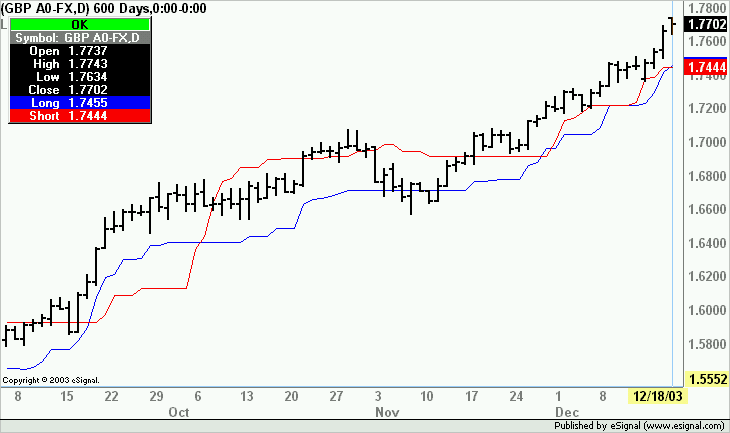
    Long Stop Formula
    HHV(C-(2*ATR(20)),14)
    HHV=Highest High over the last 14 days
    C=Last Close
    ATR=average True Range over last 20 days

    Short Stop Formula
    LLV(C+(2*ATR(20)),14)
    LLV=Lowest Low Value over last 14 Days

    I wanted to download the intraday data into Metastock but dont have the Professional version so I need to use the charting facility in esignal but need the stop lines for trading.

    PLEASE HELP
    Rory Weinstein

  • #2
    I am going to take a crack at this because I am curious what will get plotted. Some clarification of the formula is in order.

    In the formula: HHV(C-(2*ATR(20)),14)
    where
    HHV=Highest High over the last 14 days
    C=Last Close
    ATR=average True Range over last 20 days

    do you mean
    highest value of (C-(2*ATR(20)) over the last 14 days
    or
    highest Close over the last 14 days * (C-(2*ATR(20))

    Makes in difference in the coding. I'm guessing you mean the first.

    Comment


    • #3
      RE: Reply to post 'Long and Short Stop Formulas'

      ;
      charset="us-ascii"
      Content-Transfer-Encoding: 7bit

      Hi Gavishti
      Firstly thank you for replying to my SOS.
      The formula is
      highest high value over the last 14 days * (C-(2*ATR(20))
      Your second option is correct but you use the highest high not the
      highest close for HHV.

      I will be happy to show you how these stops interact with the rest of
      the system.

      I have a webcam which could be a good way of communication. We could
      also use audio if you have a mic and speakers.

      I am on msn -Send me your address and Ill hook you up.

      Thanks again for trying.
      Rory


      -----Original Message-----
      From: [email protected] [mailto:[email protected]]
      Sent: Thursday, 18 December 2003 11:57 AM
      To: [email protected]
      Subject: Reply to post 'Long and Short Stop Formulas'

      Hello rweinstein,

      ~~~~~~~~~~~~~~~~~~~~~~~~~~~~
      Rory Weinstein

      Comment


      • #4
        Prefer to do this in the forum in case someone else wants to monitor.

        So the formula is:
        HHV(14) * (close() - 2 * ATR(20))
        where
        HHV(14) = Highest High of the past 14 bars
        close() = Close of current bar
        ATR(20) = Average True Range of past 20 bars

        Comment


        • #5
          Here's your EFS. It gives pretty big numbers. I did the math by hand to confirm that the result is what should come from the formulas. Ran it on YM H4. Doesn't make any sense to me.

          What type of commodities?
          Attached Files

          Comment


          • #6
            RE: Reply to post 'Long and Short Stop Formulas'

            ;
            charset="us-ascii"
            Content-Transfer-Encoding: 7bit

            The yellow line is the long stop while the purple is the short stop.
            Look how the risk to stop have improved dramatically without getting
            stopped out on the retracements.
            Let me know if you get this
            Cheers Rory

            -----Original Message-----
            From: [email protected] [mailto:[email protected]]
            Sent: Thursday, 18 December 2003 2:21 PM
            To: [email protected]
            Subject: Reply to post 'Long and Short Stop Formulas'

            Hello rweinstein,

            ~~~~~~~~~~~~~~~~~~~~~~~~~~~~
            Rory Weinstein

            Comment


            • #7
              Rory
              Attachments will not come through when replying with an email client. You have to be online in the Forums to attach images
              Alex

              Comment


              • #8
                Copying and Pasting into the Forum.

                Please explain how to drop in a sreenshot by Copying and Pasting into the Forum.
                Thanks Rory
                Rory Weinstein

                Comment


                • #9
                  Rory
                  While posting a reply online scroll down the page to the Attach File section and click the Browse button. That will open a window that will allow you to navigate to the folder on your driive where the image you want to attach is located.
                  Note that you can attach one file only per message.
                  Hope this helps
                  Alex

                  Comment


                  • #10
                    Attachment of the Long and Short Stops

                    Gavishti.
                    I hope that this helps.
                    Please let me know
                    Thanks
                    Rory
                    Attached Files
                    Rory Weinstein

                    Comment


                    • #11
                      Rory,

                      Looked at your chart. Did some thinking about what you are doing and believe that I know what the formula should be to get the results you want. I should be able to make the changes this weekend.

                      You can then test it out and see if it produces the desired result.

                      Comment


                      • #12
                        RE: Reply to post 'Long and Short Stop Formulas'

                        Mate
                        That sounds great.
                        I can't wait to try it.
                        Cheers
                        Rory

                        -----Original Message-----
                        From: [email protected] [mailto:[email protected]]
                        Sent: Friday, 19 December 2003 2:36 PM
                        To: [email protected]
                        Subject: Reply to post 'Long and Short Stop Formulas'

                        Hello rweinstein,

                        ~~~~~~~~~~~~~~~~~~~~~~~~~~~~
                        Rory Weinstein

                        Comment


                        • #13
                          Rory
                          In looking at the image you posted it would appear that the formula is not the highest High/lowest Low over 14 periods multiplied by the equation Close plus/minus 2 times a 20 period ATR but the highest/lowest value OF the equation over 14 periods.
                          If that is the case then I think the attached efs should do what you asked. Both parameters (length of the ATR and lookback for the HHV/LLV) can be adjusted through Edit Studies
                          Alex

                          Attached Files

                          Comment


                          • #14
                            Rory
                            An additional note. The prior formula calculates the Long and Short stops in real time ie using the Close of the current bar.
                            If you prefer to have it based on the Close of the prior bar then substitute Lines 39 and 40 of the formula with the following

                            var vPlot1 = close(-1)-(2*vATR.getValue(ATRStudy.ATR,-1));
                            var vPlot2 = close(-1)+(2*vATR.getValue(ATRStudy.ATR,-1));

                            This will result in the stops being displaced forward by one period.
                            Alex

                            Comment


                            • #15
                              Rory,

                              Does the EFS that Alex supplied do what you want? If so, I will not finish the code this weekend. Be sure to check against values of your original system closely. There is a noted problem with the built-in ATR supplied by eSignal.

                              Comment

                              Working...
                              X