Announcement

Collapse
No announcement yet.

Stoch Crossover

Collapse
This topic is closed.
X
X
 
  • Filter
  • Time
  • Show
Clear All
new posts

  • Stoch Crossover

    Hello ,

    I hope you can help me. I think it is very easy for a esf specialist.
    I searched but I didnt find anything.
    I need a simle stoch crossover system which gives me an arrow.
    And maby a second one which paints the bars when the stochastic crosses. If oversold or so doesnt matter.

    Thanks in advance

    Tomcat
  • #2
    Tomcat
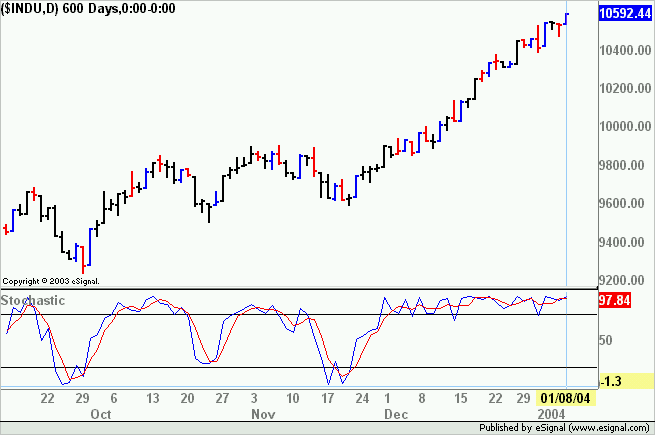
    The attached efs plots a Stochastic and paints the price bars in blue/red at the crossovers.
    All parameters for the Stochastic can be modified through Edit Studies
    Alex

    Attached Files

    Comment


    • #3
      Tomcat
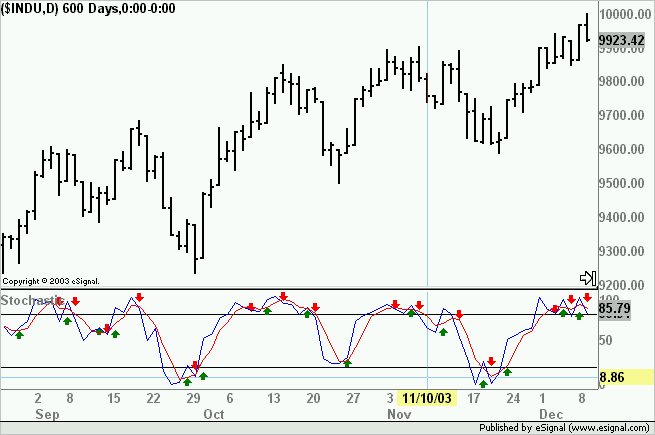
      Here is the Stochastic that plots the arrows. It was unclear to me if you wanted the arrows in the price pane (in which case one cannot plot also the Stochastic) or in the indicator pane.
      Note that the arrows are in real time ie as soon as the plots cross the arrows appear and may disappear at the close of the bar if the cross is not confirmed.
      If you want the arrows in the price window and if you want to have them appear only at the close of a bar let me know as those are very easy changes to implement
      Alex

      Attached Files

      Comment


      • #4
        Thank you,

        this is a great help at this time. But now my bars are black.
        I want them as usual. Is this possible?

        Tomcat

        Comment


        • #5
          Tomcat
          Which of the two formulas are you referring to?
          When you say "as usual" do you mean green/red for up/down?
          If you want that for the efs that paints the bars what color do the crossover bars have to be?
          Let me know as changes in either efs should be easy to implement.
          Alex

          Comment


          • #6
            I would like to implement in the study you gave that I see green/red for up/down.

            I you want you could give me an other study which paints the bars in blue/red with the same stoch.

            Thanks

            Tomcat

            Comment


            • #7
              Tomcat
              If you are referring to the efs which plots the arrows just open it with the Editor and at the beginning of Lines 24 and 25 type a // so that they are commented out. The result should be as follows
              //setColorPriceBars(true);
              //setDefaultPriceBarColor(Color.black);
              Then save the efs with the same name
              As to the efs that paints the bars at the crossovers I already posted it (see my first reply to your initial message)
              Alex

              Comment


              • #8
                It works great. Many thanks.
                Can you tell me what I have to change if I want to see the
                arrows in the chart?

                Tomcat

                Comment


                • #9
                  Tomcat
                  Although the changes are relatively easy it is easier to post the efs.
                  Remember that if one plots on the price pane (even if only arrows) one cannot at the same time plot in an indicator pane so, if you want to see the Stochastic you will have to load it separately.
                  The attached efs behaves in the same way as the one with arrows posted earlier ie the arrows will appear/disappear in real time intrabar.
                  Alex
                  Attached Files

                  Comment


                  • #10
                    Advanced Get Stochastics

                    Alex:
                    Thank you for all the work you have done and I have a question - can your efs use (call) the Advanced Get False Bar Stochastic instead of the regular stochastic? I like the arrow concept with an alert. With the Advanced Get False Bar Stochastic, there are no signals (to go short in an overbot area) when the the False Bar appears (at the new highs). Also, when the stochastic sells off with a False Bar at the former highs, and then crosses back up from oversold, (without another False Bar appearing) this is an especially strong signal.
                    Harndog

                    Comment


                    • #11
                      Tomcat
                      The efs I posted uses the builtin Stochastic. In order to also have the false bar I will have to rewrite the efs adding the builtin AdvancedGet Stochastic so as to retrieve the status of the False Bar. I will try to look into this later
                      Alex

                      Comment


                      • #12
                        You gave me what I need. Thank you.

                        But the arrows are very small. Can I enlarge them?

                        Tomcat

                        Comment


                        • #13
                          Tomcat
                          Those are the builtin shapes and cannot be modified (they auto-size depending on the bar spacing).
                          However if you have wingdings font on your machine I can easily switch to using the shapes from that font that can be easily sized (and also separate better from the bar too BTW).
                          Alex

                          Comment


                          • #14
                            Tomcat
                            The attached revision uses Wingdings font instead of shapes to draw the arrows. To change the size open the efs with the Editor and replace the 10 (after "Wingdings") in Lines 73 and 80 with a value of your choice
                            Alex
                            Attached Files

                            Comment


                            • #15
                              Great. Thanks an a nice WE.

                              Tomcat

                              Comment

                              Working...
                              X