Announcement

Collapse
No announcement yet.

Pivot

Collapse
X
 
  • Filter
  • Time
  • Show
Clear All
new posts

  • Pivot

    Hello,

    is it possible to draw the pivot lines to the right hand side.
    Maby ten minutes. Can this be realised with efs.

    Thanks

    Tomcat
  • #2
    Tomcat
    Do you mean using one of the pivot efs that are in the Pivots subfolder of Formulas? If yes which one?
    Alex

    Comment


    • #3
      Alexis,

      I ment the "Pivot Pointall.efs" study.

      Tomcat

      Comment


      • #4
        Tomcat
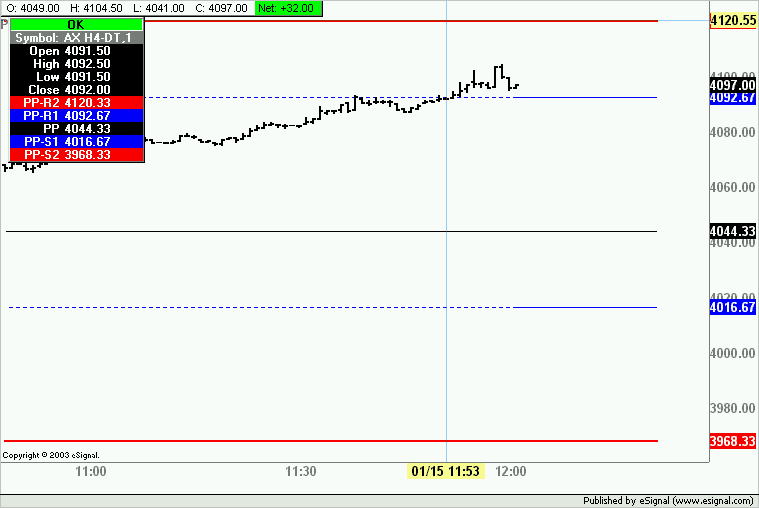
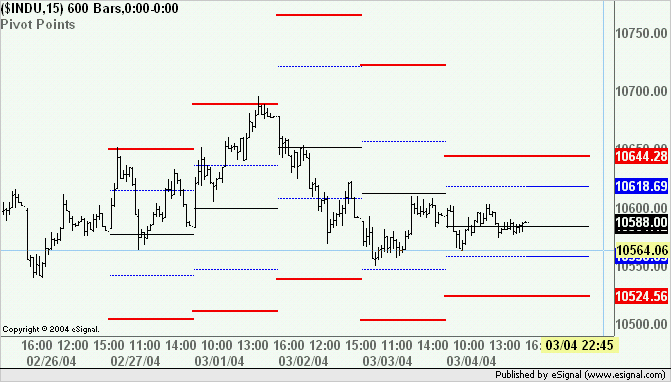
        Attached is a modified PivotPointAllNew (which I believe is a newer version of PivotPointAll) with the pivot lines extended 20 bars to the right.
        Alex

        Attached Files

        Comment


        • #5
          Great. Thanks.

          Tomcat

          Comment


          • #6
            But it doesnt work. I dont know why it works by you.

            Tomcat
            Attached Files

            Comment


            • #7
              Tomcat
              I made a change and the version attached here should now work
              Alex

              Attached Files

              Comment


              • #8
                It works. Many thanks.

                Tomcat

                Comment


                • #9
                  Woodiesccipivots..not work

                  I have tried to modify this formula several times with no succes.

                  Is there a way to be able to change the starting time...reason being that the ZB bond pivots should start at 7:20 am est...and the YM pivots should start at 9:30 am est.

                  I use this on a timeplate (YM) set to dynamic 9:30 4:15 ...and the (ZB) bonds 7:20 4:00 close..and it will not compute properly.

                  Woodies CCI Pivots formulas is h/l/o/o/4.....
                  previous day hi ....lo
                  todays open twice...bonds 7:20.....ZB.

                  Why won't this work the way it is coded..to get the open of today...If I open chart before 9:30...I will close and reopen or reload the formulas after the open

                  Thanks

                  Barbara

                  Comment


                  • #10
                    Barbara
                    Actually the efs does work the way it is coded. Irrespective of the Time Template you may be using - the formula derives the OHLC values from the Daily bars. These are based on the full trading sessions which are 19:00-16:00 CT for ZB and 19:15-16:00 CT for YM. Hence the values used for the Open are those at 19:00 and 19:15 respectively and not 7:20 and 9:30.
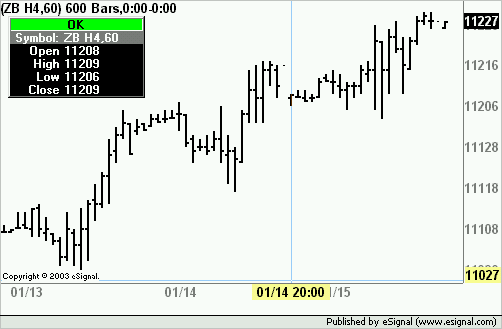
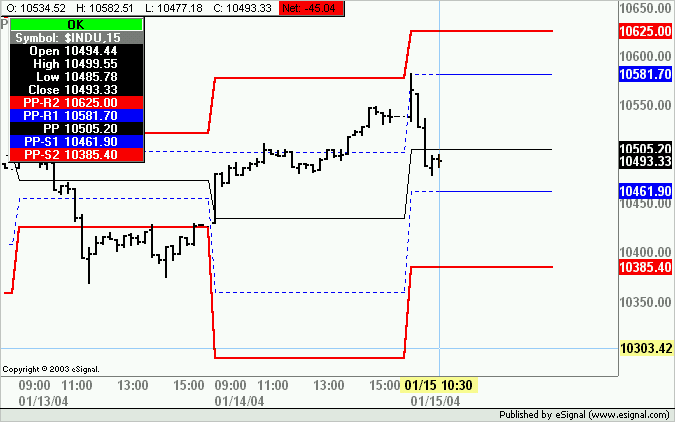
                    Following is a 60 min chart for the complete session of ZB H4 with the cursor on the opening bar of the January 15 session ie 19:00 of January 14th (the chart shows 20:00 because I am on ET).


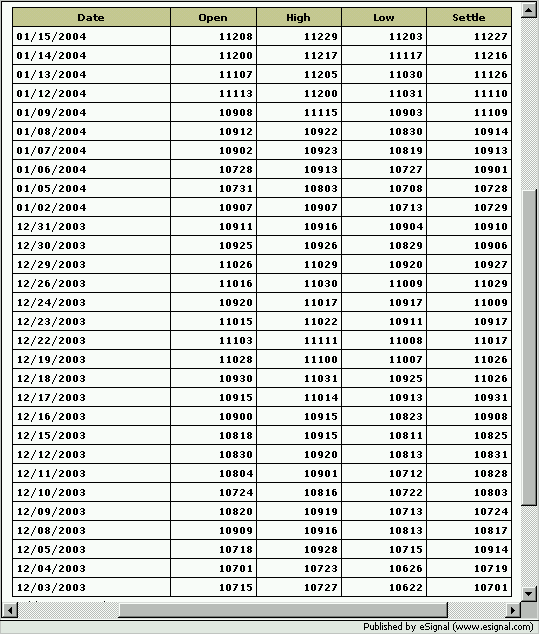
                    And below is a table from the CBOT itself. As you can see the opening value for 1/15 is 11208 which is the same value as in eSignal's chart and not 11218 which is the "open" at 7:20 CT. FWIW you can see the table by clicking here


                    The same thing would happen for example if you were calculating Woodie's pivot with ES. The only difference is that for that symbol there is an artificially created equivalent (using the =2 suffix) that plots only the Regular Trading Hours thereby making it possible to use those "daily" values.
                    Alex

                    Comment


                    • #11
                      Alex,

                      could you give me a hand and make it possible that the formula Posted: 01-15-2004 05:57 PM from you only shows maybe
                      five days back?

                      Thanks in advance

                      Tomcat

                      Comment


                      • #12
                        Hello Tomcat and Alex,

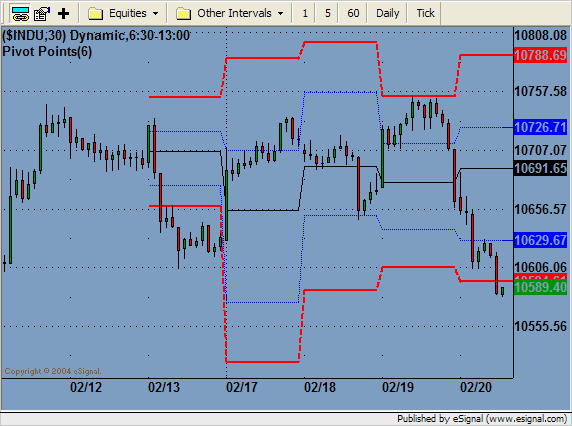
                        Here's a little code snippet that will do what you need to only display the last 5 days. The code below can be incorporated into any formula for this purpose. There is one input parameter that controls the number of days to display, nDays. The default is set to five days. However, around a holiday week, such as this week, only 4 days will be displayed. So if you change nDays to 6 it will include Friday the 13th as the fifth day. What this code snippet does is set vDisplayDate to be equal to nDays prior to the current date, plus 2 days to account for weekends. I've also added this code to Alex's latest formula below.

                        pivotpointallnew(extend)2.efs

                        PHP Code:
                        var vDisplayDate null;
                        var 
                        bDisplay false;

                        function 
                        main(nDays) {
                            if (
                        vDisplayDate == null) {
                                if (
                        nDays == nullnDays 5;
                                var 
                        msPerDay = (24 60 60 1000);
                                
                        vDisplayDate = new Date() *1;
                                
                        vDisplayDate vDisplayDate - ((nDays+2)*msPerDay);
                                
                        vDisplayDate = new Date(vDisplayDate);
                            }
                            if (
                        bDisplay == false && getDay(0) != getDay(-1)) {
                                var 
                        vDate getValue("Time");
                                
                        vDate = new Date(vDate);
                                if (
                        vDate >= vDisplayDate) {
                                    
                        bDisplay true;
                                }
                            }
                            if (
                        bDisplay == false) return;


                        // your formula code here

                            
                        return;

                        Jason K.
                        Project Manager
                        eSignal - an Interactive Data company

                        EFS KnowledgeBase
                        JavaScript for EFS Video Series
                        EFS Beginner Tutorial Series
                        EFS Glossary
                        Custom EFS Development Policy

                        New User Orientation

                        Comment


                        • #13
                          Alex,

                          could you help me again.

                          I cant erase the vertical lines in the pivot efs study with only five days back and with extended 20 bars to the right.
                          What do I have to delete?

                          Thanks

                          Tomcat

                          Comment


                          • #14
                            Tomcat
                            Replace the corresponding section of preMain with the following
                            Alex

                            PHP Code:
                            // R2
                                
                            setPlotType(PLOTTYPE_FLATLINES,0)
                                
                            setDefaultBarStyle(PS_DASH0);
                                
                            setDefaultBarFgColor(Color.RGB(255,0,0), 0);
                                
                            setDefaultBarThickness(20);

                                
                            // R1
                                
                            setPlotType(PLOTTYPE_FLATLINES,1)
                                
                            setDefaultBarStyle(PS_DOT1);
                                
                            setDefaultBarFgColor(Color.RGB(0,0,255), 1);
                                
                            setDefaultBarThickness(11);   

                                
                            // Pivot  Point
                                
                            setPlotType(PLOTTYPE_FLATLINES,2)
                                
                            setDefaultBarStyle(PS_SOLID2);
                                
                            setDefaultBarFgColor(Color.RGB(0,0,0), 2);
                                
                            setDefaultBarThickness(12);

                                
                            // S1
                                
                            setPlotType(PLOTTYPE_FLATLINES,3)
                                
                            setDefaultBarStyle(PS_DOT3);
                                
                            setDefaultBarFgColor(Color.RGB(0,0,255), 3);
                                
                            setDefaultBarThickness(13);

                                
                            // S2
                                
                            setPlotType(PLOTTYPE_FLATLINES,4)
                                
                            setDefaultBarStyle(PS_DASH4);
                                
                            setDefaultBarFgColor(Color.RGB(255,0,0), 4);
                                
                            setDefaultBarThickness(24); 

                            Comment


                            • #15
                              Perfect. Thanks

                              Comment

                              Working...
                              X