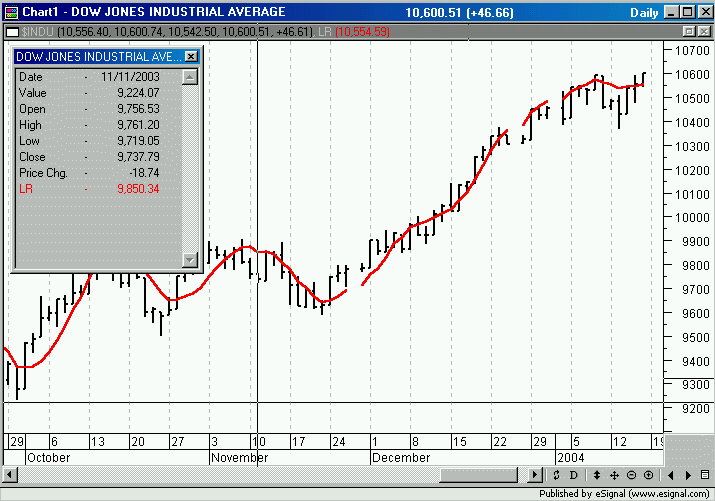
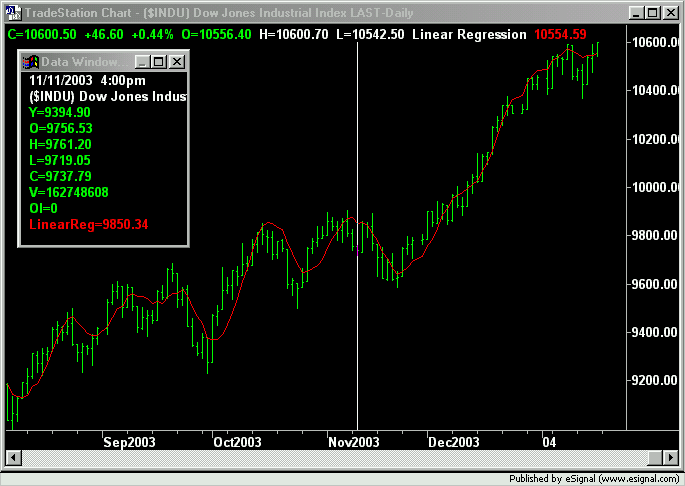
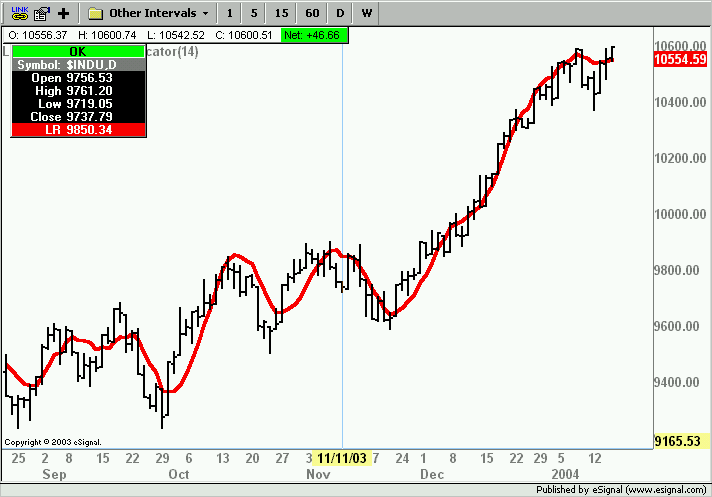
Does this study exist? It is not the same as Linear Regression, which is already a current study. The Linear Regression study, creates the channel +/- the number of std. deviations you specify. I am looking for a Moving Linear Regression line, that I can adjust the parameters i.e. price type and length. This line draws the best way thru the sum of squares. I've seen both of these on other platforms, so I can't imagine that eSignal can't offer as well. Thanks
Announcement
Collapse
No announcement yet.
Moving Linear Regression
Collapse
X
-
Re: Reply to post 'Moving Linear Regression'
; charset=us-ascii
Alexis,
Thanks for your reply. I have searched both places you
mentioned.....there is much about Linear Regression, the channel, but
nothing appears to be available regarding a study for a Moving Linear
Regression line. This is different than what I have been able to find
from searching the boards. Please advise if I have missed it or if
eSignal can offer this to me. Thanks again!!
Greg
forumpost@forum.esignal.com wrote:
Hello heres14u,
~~~~~~~~~~~~~~~~~~~~~~~~~~~~
Comment
-
Re: Reply to post 'Moving Linear Regression'
; charset=us-ascii
Alex,
Thanks for trying to help. I wasn't getting anywhere with eSignal's
people on the phone..that's why I thought I would try this forum. I am
not a programmer, and therefore don't know code, if that is what you
meant by code...that's what I am looking for help with. I can't believe
that eSignal as large as it is, does not have this option. I am
currently trying a demo of another applic. where I can use this
strategy....when building my charts I simply pull down the menu for
indicators and it list probably 50 diff. ones....but I can pick Linear
Regression line (the channel w/std. deviations) and then I can also
choose Moving Linear Regression. I don't want to cancel eSignal and so
was in hopes that it would be as easy with them....when building charts,
pull down Basic studies and choose the study you want to add. Again,
doing it this way only gives me Linear Regression (the channel) and not
the Moving LR line which as best as I can describe the MLR line is the
best way thru the sum of squares. I am confident this can be done...
added as a study, but don't know how to go about doing it. Please
advise further.
Thanks,
Greg
forumpost@forum.esignal.com wrote:
Hello heres14u,
~~~~~~~~~~~~~~~~~~~~~~~~~~~~
Comment
-
Greg
Try the attached Linear Regression efs.
Download and save to any one of the subfolders of Formulas. To load it in a chart right click the chart, select Formulas then navigate to the subfolder you saved the efs in and click it.
The Default setting for the Length is 5 but can be modified through Edit Studies.
AlexAttached Files
Comment
-
Re: Reply to post 'Moving Linear Regression'
; charset=us-ascii
Alex, that is really close to what I am looking for. Was this somewhere
and I missed it, or did you just create it? For this efs, If we could
add "price source" under edit studies where I can choose the type ie.
close or open or high or low or volume etc. then by gosh I think we
would have it.
Also, separate question: under edit studies, chart type: line/tick,
how can I change the characteristic of the line ie pen width and and
style. It appears to only let me change the color and price source.
Any thoughts?
forumpost@forum.esignal.com wrote:
Hello heres14u,
~~~~~~~~~~~~~~~~~~~~~~~~~~~~
Comment
-
Greg
Actually there are various versions of it in the Bulletin Board under Linear Regression and other names.
The attached version allows you to select the input source besides modifying the length.
AlexAttached Files
Comment
-
Greg
With regards to the Line/Tick chart question you can modify the line thickness (or pen width to use your conventions) but not the style.
To modify the line thickness click on the Increase Bar Width (and related Decrease Bar Width) icon in the main toolbar. If you want you can also assign hot keys for this task through Customize Keyboard.
Alex
Comment
-
Alex,
I've downloaded and applied the efs you supplied to my charts. It looks real close to what I need except one problem....after further review and comparison, this Moving Liner Regression has a flaw in its calculations. I am comparing eSignal's calculated values for +1/-1 std. deviations using the efs you attached, and it comes up with different values than that found on another charting platform. Could someone who writes code for these studies check the calculations of the efs provided or perhaps make a new one for a moving linear regression line. Thanks
Comment
-
Greg
I do not know what software package you are comparing it to, but I have run the Linear Regression studies on my copies of TradeStation 2000i and Metastock Professional 8.0 and they all match the one I posted.
If you can provide the code from the software you are using that may make it easier to verify where those differences may be.
Alex
Comment
-
Alex,
I am sorry for the mix up. The values I am comparing for both the Moving LR line and the LR channel do not match up in a given time period with the other platform....Direct Access Elite. I'm not sure what's going on. The Moving LR line is configured with same parameters in both, as well as the LR channel... 23 periods- from the close with +1 Std. Dev. and -1 Std. Deviation. I think it has something to do with how my time is config. within Esignal. I have played around with this and still can't seem to get it right. In Direct A.Elite I have my chart scaling set to linear price scaling and yes to show pre and post market trades....that's it...pretty simple. Yet when I compare figures between the two I come up with different values. What is the proper way to set this same type of scaling with Esignal? Thanks for your continued help with nailing this down....I think we are real close.
Comment
-
heres14u
Just a simple reflection.
Sometimes people approaching a new platform are in some way "reluctant" in find solutions. So they point the finger on the Platform.
I remark the fact where you say "I can't believe that Esignal big corporation ........"
Moving RTC is available as EFS since April of last year : just type in the Search engine the key words and you find a mop of RTC . But I believe is easier to say "there is not such a study".
BTW Moving RTC has been written by a great professional in coding efs like the gentleman whit whom you are talking to.
I am not sure you completely tried the EFS since not only is moving but can adjust its STD according to the highest Bar volatility.
I do not want to know why you use STD +/- 1 ( its reducing by 29% the chances that the auction will stay inside the RTC channel ( ref. Graham -Dodds) ) but please , just compare professional platforms with Professional platform. Even if the RTC is a quite simple formula , and has been widely demonstrate that the output is right.
Please be aware that besides the number of studies ESIG offer there is more tan 1000 other studies available through FREE EFS.
If you add the Commercial ones , we get probably to more than 1500.
CordiallyLast edited by fabrizio; 01-18-2004, 12:22 AM.Fabrizio L. Jorio Fili
Comment
-
Greg
You may want to post a chart from the other platform and the equivalent chart you have set up with eSignal preferably with the indicator loaded in both. This may allow to spot differences in the setups of the charts that could cause the discrepancies you are seeing at your end.
It would also be useful if you to contact Direct Access and ask them what calculations they use to compute the indicator.
Alex
Comment


Comment