 Tweet
Tweet
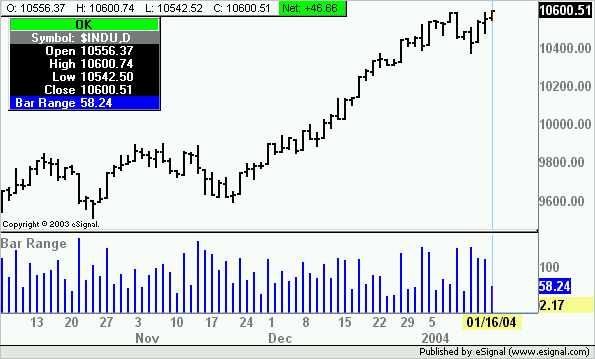
Can someone help me with an efs to plot the range per bar in either a histogram or line plot
-
-
Phil
The attached efs will plot the bar range
Alex
-
question
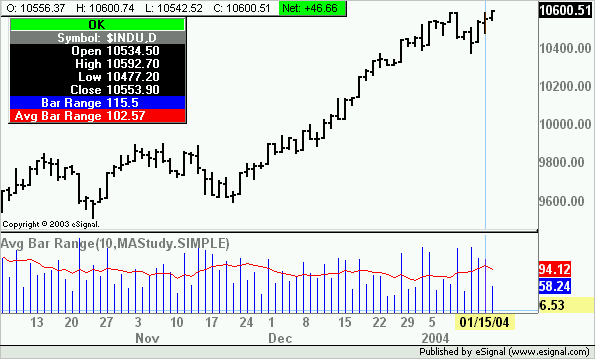
Can i lay an average over the plot of range???
and can you help with the other question i have on
the board about plotting a "price slope"
thanks
PhilComment
-
Phil
The attached efs also includes the average. By default the formula is set for a 10 period Simple MA, but can be modified through Edit Studies.
Alex
Comment
-
thanks
PhilComment
Comment