 Tweet
Tweet
Does anyone know where I can get the Heikin-Ashi EFS. Thanks
-
-
Jason K.
Project Manager
eSignal - an Interactive Data company
EFS KnowledgeBase
JavaScript for EFS Video Series
EFS Beginner Tutorial Series
EFS Glossary
Custom EFS Development Policy
New User Orientation -
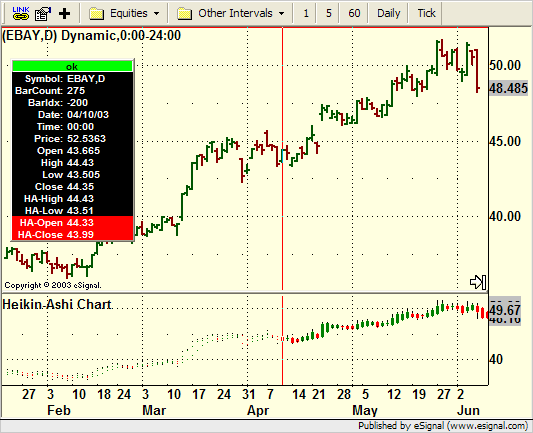
Has anyone else noticed that the Heikin chart goes kinda crazy if you go too far back? Looking at a daily chart of EBAY it stops plotting correctly back before 04/09/03. Same observation on intraday charts... it goes to a sort of "cloud" type plot, which is still somewhat visually represented if you zoom way out...
Any idea why this is?
JonathanComment
-
Scratch that... on examing the code, the comments state that it draws the most recent 200 bars. I'm guessing that's what's going on. Now, to try and change it...
JonathanComment
-
Hello Jonathon,
The study uses drawing functions to create the body and wick for the bar images. The study limits the number of historical bars to be drawn to 200 bars. Beyond the 200 bars all you will see are the data points for the OHLC returned to the chart, which are plotted with the DOT plot type. The reason for this limit of 200 is that too large a collection of images drawn on a chart becomes a memory hog. If you want to view a larger history of bars on the daily chart, open the formula in the editor and change the "200" on line 61 to a larger number. Save and then reload the formula.
PHP Code:if (iCntr > 200) iCntr = 0;
 Jason K.
Project Manager
eSignal - an Interactive Data company
EFS KnowledgeBase
JavaScript for EFS Video Series
EFS Beginner Tutorial Series
EFS Glossary
Custom EFS Development Policy
New User OrientationComment
-
Thanks Jason, nice to see that my hunch was correct.
Now... this is a very interesting charting tool to me, and I want to take it a bit further, but am new to Esignal so am not entirely certain how to do so. Specifically, I would like to:
1) Have my actual price bars inherit their color from the Heikin plot, and
2) Turn it into some sort of backtestable system, by entering long & short at the close as indicated by the colors.
I don't actually expect such a system to do extremely well, I can see that it will get quite whipsawed all over the place, but it's a starting point from which I wish to launch. My coding abilities are mostly limited to cut & paste, or hack & slash, so I'm afraid that my attempts thus far to combine bits of code from a simple Wizard-based system, with bits of code from the EFS in this thread, have failed to yield anything functional. Could you or anyone else offer suggestions, or even code examples, of how to accomplish either or both of my goals above?
Thanks much!
JonathanComment
-
Hello Jonathan,
1) Add the following to the preMain() function.
setColorPriceBars(true);
setDefaultPriceBarColor(Color.black);
In the main() function add the following line after the 2 setBarFgColor() functions on lines 75 and 76.
setPriceBarColor(vColor);
2) To turn this into a back testing formula you need to add some conditions to the formula to generate buy/sell signals. Inside those conditions you would add the Back Testing/Strategy functions. For more information on the Back Testing functions, please visit the EFS Help Center and review the Guide to Developing Strategies and the EFS Function reference materials for Back Testing/Strategy.Jason K.
Project Manager
eSignal - an Interactive Data company
EFS KnowledgeBase
JavaScript for EFS Video Series
EFS Beginner Tutorial Series
EFS Glossary
Custom EFS Development Policy
New User OrientationComment
-
Hi again,
This is great, thanks! It works like a charm and is far simpler than what I was attempting. The backtesting stuff I guess I'll try to figure out on my own... in the meantime though, one last question:
Since I now have my price bars colored based on the Heikin chart, is there any way to not have the lower Heikin study on the chart at all? I'd love to JUST see a clean chart of Heikin-colored price bars, and nothing else. Can't seem to figure out how to do it by editing the .efs...
Thanks again!
JComment
-
Jonathan
The attached revision of the efs only colors the price bars and removes the indicator window.
The changes include those suggested by Jason to paint the bars
Alex
Comment
-
WOW, you folks are great! Thanks so much. The comments especially are terrific, I can now see exactly what I was missing, which looks to be commenting out retArray and replacing it with return.
Thanks again. What a great resource you all are!
JonathanComment
-
RE: Reply to post 'Heikin-Ashi'
Where do I download the Heikin-Ashi study?
Thnx,
Ron
-----Original Message-----
From: [email protected] [mailto:[email protected]]=20
Sent: Friday, January 30, 2004 8:38 PM
To: [email protected]
Subject: Reply to post 'Heikin-Ashi'
Hello RNuckles,
~~~~~~~~~~~~~~~~~~~~~~~~~~~~Comment
-
Ron,
Take a look at the bottom of this thread, Jason posted the link to it in response to someone else's original request for the location of the study.
JonathanComment
-
Alexis or Jason -
OK, I thought I was done with questions, but they tend to beget more questions, so...
I am experimenting with using the Heikin colors to determine when to exit a trade. I have an entry signal (say a close above or below a simple MA) and when it happens, I enter a trade in the direction of the breach, and stay in it until the Heikin color reverses. I can't figure out how to get a system to detect the Heikin bar state. Any suggestions? Is there a way to actually analyze the current displayed color of a bar, and then act accordingly? Or would this need to be done some other way?
Thanks again!
JComment
-
RE: Reply to post 'Heikin-Ashi'
Thanks for your help and sorry to have troubled you.=20
Ron
(still looking)
-----Original Message-----
From: [email protected] [mailto:[email protected]]=20
Sent: Friday, January 30, 2004 10:51 PM
To: [email protected]
Subject: Reply to post 'Heikin-Ashi'
Hello RNuckles,
~~~~~~~~~~~~~~~~~~~~~~~~~~~~Comment
-
Jonathan
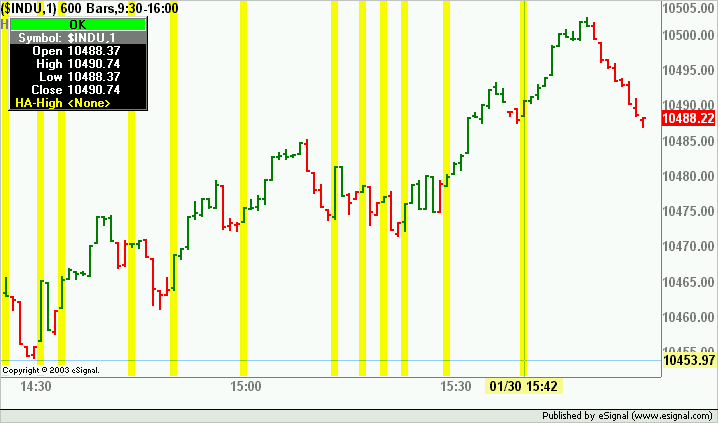
Is there a way to actually analyze the current displayed color of a bar, and then act accordingly?
Here is an example of one way of doing it. The conditions are for the prior color to be cBear and the current to be cBull. When that condition is met the efs paints the background of the bar in yellow.
Alex
Comment
Comment