Announcement

Collapse
No announcement yet.

Slope of Linear Regression Bars

Collapse
X
 
  • Filter
  • Time
  • Show
Clear All
new posts

  • #16
    Hi Steve, thanks for posting your efs program. Unfortunately,when i loaded it i got the following error message from the Formula Output":
    "Line 29: close() can only be called in main()"
    I can see this line under the editor, but not being a programmer, I have no idea whether anything's wrong! Can you help?
    Thanks
    John

    Comment


    • #17
      Hi John,

      Thanks, the efs below that you uploaded was not intended to be a stand alone efs, but an efs with sections that could be added to your code. That is why it gave you the error.

      On a positive note, I had generated an efs to be stand alone with these steps in it and had posted in my fileshare area subsequent to the original post. This morning, I updated the efs to reflect some things I have learned since then. I will attach the efs.

      A copy of this and other efs's are in my fileshare area titled Functions. Here is the link

      http://share.esignal.com/groupconten...ns&groupid=339

      And here is the updated efs
      Attached Files

      Comment


      • #18
        Hi Steve, my apologies, I thought i had read the previous posts properly but i obviously missed out on the vital piece of info!
        Thanks for posting the latest efs and your filesharing forum
        Much appreciated,
        John

        Comment


        • #19
          John,

          No problem, in hindsight, my previous posts were clear as mud, something I am periodically reminded .

          I hope this works out well for you.

          Comment


          • #20
            With the help of a friend I found that the previous study I posted did not act as expected in playback.

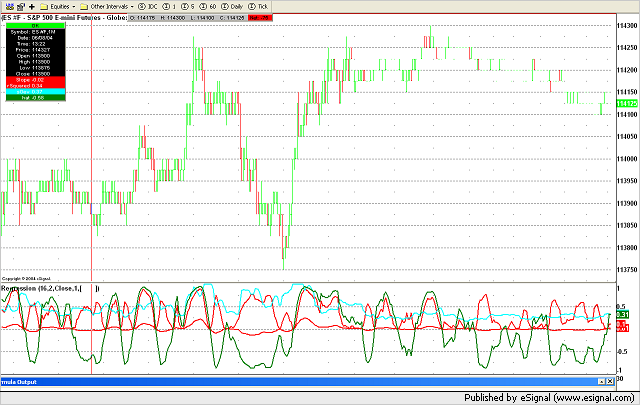
            I went ahead and rewrote it such that it returns a value every tick in real time. I also added to the regression function an object declaration which returns the regression variables as an object. The regression variables are populated into an array, which results in a 2 dimensional array.

            The variables are returned to the chart using the following with statement.

            PHP Code:
            with (btest){//using the btest "object" which now has these associated elements
                
            return new Array(SloperSquared,Standard_Deviation,hSquared); //returns the values to the chart

            This study returns a value to the non price pane. I found if I let it auto scale, the chart would flash every bar (if one of the values was at the limit of the chart scale). I added an option in edit studies to rescale the non price pane to eliminate the problem, if encountered.


            If anyone is interested, I can write another version that returns the regression to the price pane, with bands or something, just let me know.

            edit - attached latest filecopy of least squares regression
            Attached Files
            Last edited by Guest; 12-09-2004, 08:17 AM.

            Comment


            • #21
              Linear Regression Paintbars...

              Steve:

              I just came across your efs (linear regression 09 25 2004a.efs) posted below. I have been searching for a long time for an efs which utilizes r-squared values - and your formula does so wonderfully! I noticed that you would review input from users...so my thought was would it be possible for you to add an additional feature which (in my opinion) would make this efs quite versatile and easier to incorporate with other efs's on the charts? My hope was that you could paint the bars blue when the r-squared value is less than the slope value and the hat value; and paint the bars red when the r-squared value is greater than the slope value and hat value.

              Alternatively, another paintbar method which would be quite useful would be to paint the bars blue or red only when the r-squared value is above a user defined number (say .25) while the slope value and the hat value are less than 0 (red bars) or greater than 0 (blue bars). This method would allow users to vary the critical value of r-squared according to the number of periods being viewed.

              I am not sure which method would be easier to implement, but in my opinion either one would be a very very useful addition to anyone who uses a linear regression slope efs. Anyway, those are my thoughts (and hopes)...please keep up the good work!!

              Steve

              Comment

              Working...
              X