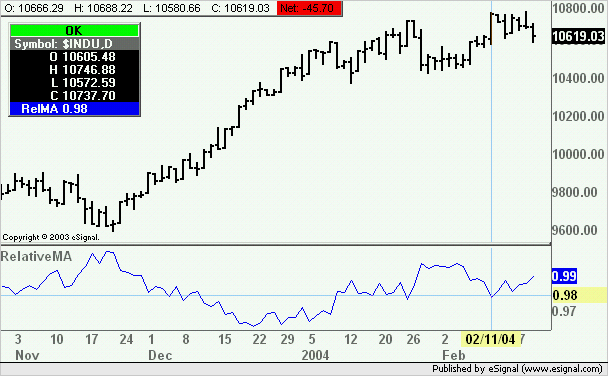
for daily close for any stock or commodity:
x= day moving average (eg 100 day moving average)
formula:
Xdaymovingaverage/closing price
example:
100 day moving average/closing price
then plot it as a line
pretty simple but can't figure out how to do it!
thanks
earl
x= day moving average (eg 100 day moving average)
formula:
Xdaymovingaverage/closing price
example:
100 day moving average/closing price
then plot it as a line
pretty simple but can't figure out how to do it!
thanks
earl

Comment