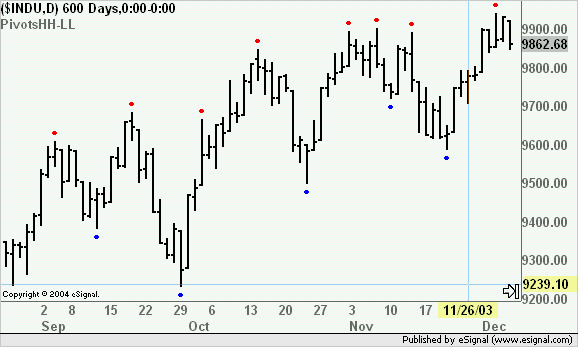
Create a Price Study Indicator to display high and low pivot points.
Pivot High:
Place a drawing symbol at the high price of the bar when the high price is greater than the high price of the the X number of bars ago (default 4) and greater than the high price of the subsequent 2 bars.
Pivot Low:
Place a drawing symbol at the low price of the bar when the low price is less than the low price of the the X number of bars ago (default 4) and less than the high price of the subsequent 2 bars.
See Attached Example

 , very good advice and easy to setup.

Comment