Announcement

Collapse
No announcement yet.

Advance decline volume study

Collapse
X
 
  • Filter
  • Time
  • Show
Clear All
new posts

  • Advance decline volume study

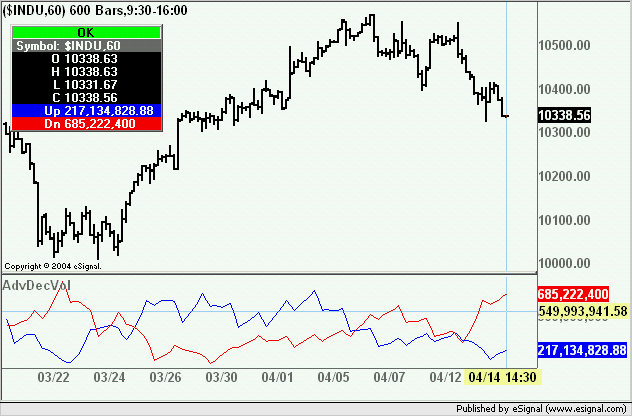
    Is it perhaps possible to develop a study with two moving averages on the volume of advancing and declining issues that appears more or less like the MACD. Meaning it can be charted without having to open a chart of the $ADV OR $DECL'S

    For example :
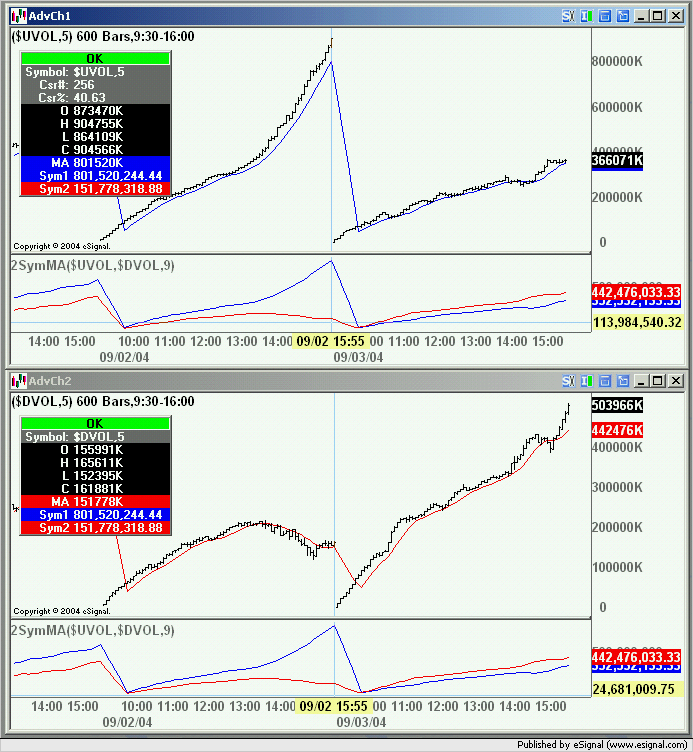
    input (lenght of moving average) for Advancing issues volume.
    input (lenght of moving average) for Declining issues volume.

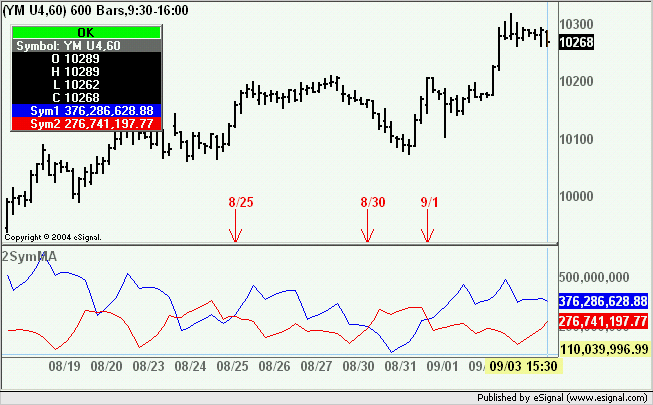
    On your lower chart you have then two moving averages say one red the other blue for the volume of $adv and the other $ decl isues.

    Will it be possible to enter a symbol so that the study can work on Nasdaq $advq and dvolq also.

    Thank you very much in advance.

  • #2
    fanie
    I am not sure that moving averages on the volume of $ADV and $DECL (or $ADVQ and $DECLQ) will provide the results you are seeking as that volume is tick volume and not the actual volume of the advancing and declining shares.
    Alex

    Comment


    • #3
      Advance decline volume

      Dear Sir

      Thank you very much for the reply regarding the advance decline volume that is tick volume and not actual volume.

      Please find attached the study i am referring to.
      [http://www.marketmavens.com/MarketMa...ley-1057003134[/URL]

      Is there a volume indicator code/symbol that can give one the results as in the above study and if so to make an efs study out of it as in the article?

      Thank you very much in advance

      Comment


      • #4
        fanie
        I am not sure if $UVOL and $DVOL (and corresponding $UVOLQ and $DVOLQ) are the symbols you may be looking for.
        FWIW the attached efs will compute the MAs (default length 9) of two symbols (defaults are $UVOL, $DVOL) irrespective of the symbol in the main window.
        In order for the efs to plot correctly the trading hours should be equivalent for all plotted symbols.
        Alex

        Attached Files

        Comment


        • #5
          Advance Decline Volume

          Dear Sir

          Thank you very much for the reply and the post efs code.
          Yes it is what I have been looking for.
          Again thanks

          Comment


          • #6
            Adjustments on the AD indicator

            Hello fanie,
            Thanks to Alexis for creating the 2symma indicator. As you've been using it what settings have you found work well for daily charts? When I've used it with Daily and Weekly charts it plots as seen in the chart Alexis posted in this thread, and at the site you linked to. When I use it on 5 or 15 minute charts, however, I don't get the same amount of indicator movement or intraday crossovers. This is with charts set to either daily(930-1600) or 24 hour /5day and various MA length adjustments? What am I missing? It seems like the appearance would be somewhat similar with different time periods? If any one else who's begun using this has suggestions I'll appreciate it. I'm probably missing something obvious. Thanks.

            Comment


            • #7
              jouster
              You cannot use a 24hr Time Template with this efs because the symbols it references only print during RTH. The Time Template Start/End times must reflect those of the symbols used in the efs (9:30-16:00 EST) else the results will be skewed.
              BTW Start/End times do not have any effect on Daily (or higher interval) charts or tick based charts.
              Alex

              Comment


              • #8
                Dynamics of the A/D indicator

                Alexis, Thanks for your response. I have set the 5m intraday chart to a 930-1600 EST time template and the symma.efs displays as below. I'm no wizard with writing these formulas and it may be I'm expecting too much intraday movement on the indicator. Although I've adjusted the period length in 'studies' it only varies slightly. When compared with the other two oscilators in the 5m chart it seems overly smoothed such as you would get with a long period programmed into it?? Is there a way to display more of the intraday dynamics of A/D volume crossovers?

                As a comparison, in the same YM chart but with Daily periods (following post), the symma.efs has multiple crossovers as do the other two indicators. I appreciate your writing the formula and it may be I misunderstand something basic here or expect something its not designed for. If there's another indicator you know of that displays normalized volume(adjusting for early am and late pm spikes in volume) or A/D that displays the same dynamics of movement on an intraday time frame I will be very grateful. An indicator that clearly shows shifts of market volume will be a great aid to my trading. Thanks very much.
                Attached Files

                Comment


                • #9
                  Dynamics of the A/D indicator

                  Alexis, Here's the same chart with the symma.efs on a Daily template.

                  Thanks
                  Attached Files

                  Comment


                  • #10
                    jouster
                    If you want to see what the study is doing set up two separate charts with the same 9:30-16:00 Time Template and in one load $UVOL and in the other $DVOL. In each chart then set up a 9 period simple moving average and load the efs.
                    Place these charts one on top of the other (as in the image below) and compare the values of the averages. You will see that they show exactly the same values being returned by the efs. You will also see that on a 5 minute interval there are hardly any crosses in up and down volumes with the default settings.
                    Alex

                    Comment


                    • #11
                      jouster
                      Another thing to consider when looking at longer intervals is that the intraday dynamics actually span across a number of days.
                      As an example see the 60 minute chart below where I included the dates of the most recent crossovers of $UVOL and $DVOL.
                      Alex

                      Comment


                      • #12
                        Cumulative vs bar by bar volume?

                        Alexis, Thanks for the education. Some distinctions are becoming clear. After looking ar your explanation and reading more about volume indicators at; http://www.marketvolume.com/content/...ine_volume.asp

                        I think the symma is reflecting cumulative volume through the market day, correct? Is it possible to represent the bar-by-bar fluctuations in ad/dec volume as two crossing ma's or a histogram for the ticker index represented in a chart? Best might be adjustable momentum or ma's of the bar-by-bar volume. Perhaps this merely means one needs to use different volume sources in the symma indicator?

                        Also, to accomplish this same goal, which is slightly different than that accomplished with the cumulative volume ma's, is it possible to plot two moving averages on the Bollinger 'Normalized Volume' indicator now included in the eSignal free indicator folders? Any or all of these options might give an indicator that provides several intraday crossovers that would help apply a/d volume to intraday trading? Thanks.

                        Comment


                        • #13
                          jouster

                          I think the symma is reflecting cumulative volume through the market day, correct?

                          As a default 2symma calculates the 9 period moving averages of the NYSE Up and Down Volume which are cumulative

                          Is it possible to represent the bar-by-bar fluctuations in ad/dec volume as two crossing ma's or a histogram for the ticker index represented in a chart?

                          That would be possible if the volume for the Advancing and Declining Issues was actual volume. As of now that volume is tick volume (see second message in this same thread).
                          Alex

                          Comment


                          • #14
                            Alex,

                            I have been searching through past threads and I found this efs that may help resolve some of the issues I've been having finding an script that can determine advancing and declining volume for a security.

                            Is it possible to tweak this efs so that it can be applied to any security? As I see it, this efs can only find the advancing and declining volume for NYSE.

                            Cheers

                            Carlton

                            Comment


                            • #15
                              Carlton
                              You can change the symbols through Edit Studies. The defaults are $UVOL and $DVOL which are the symbols for the advancing and declining volume for the NYSE
                              Alex

                              Comment

                              Working...
                              X