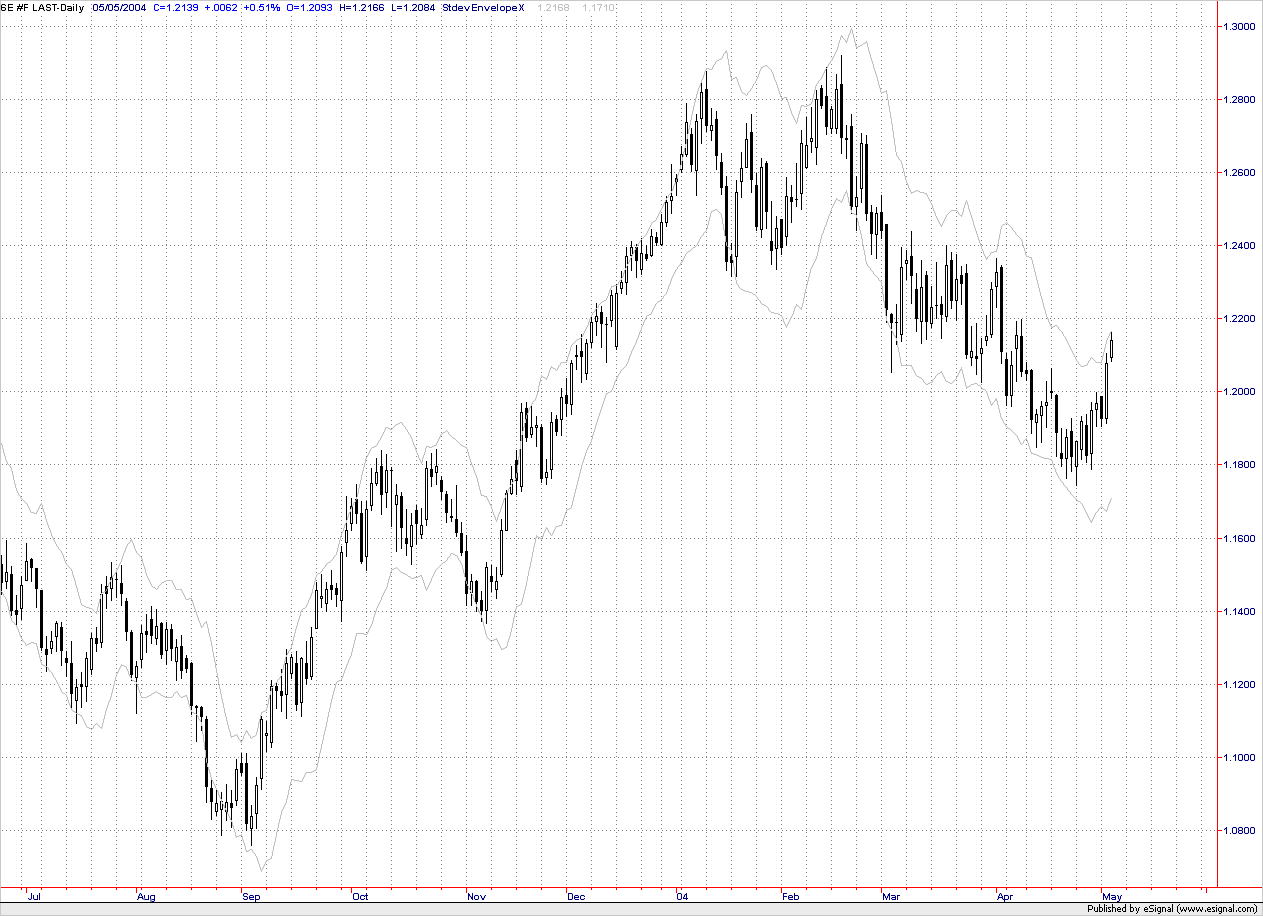
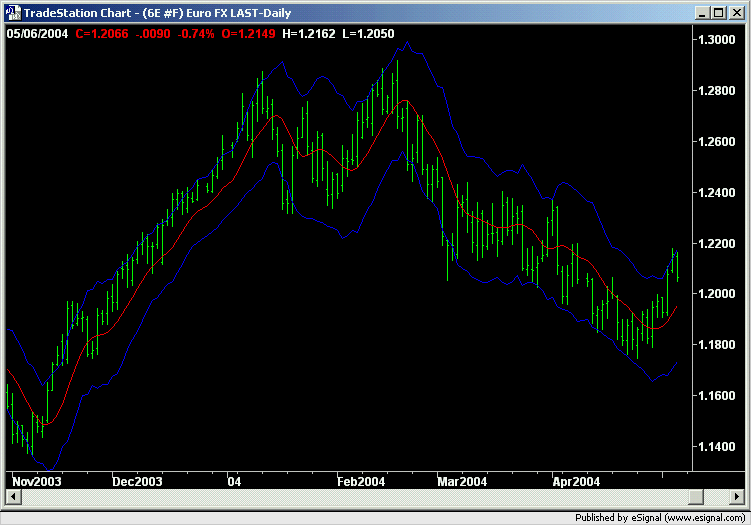
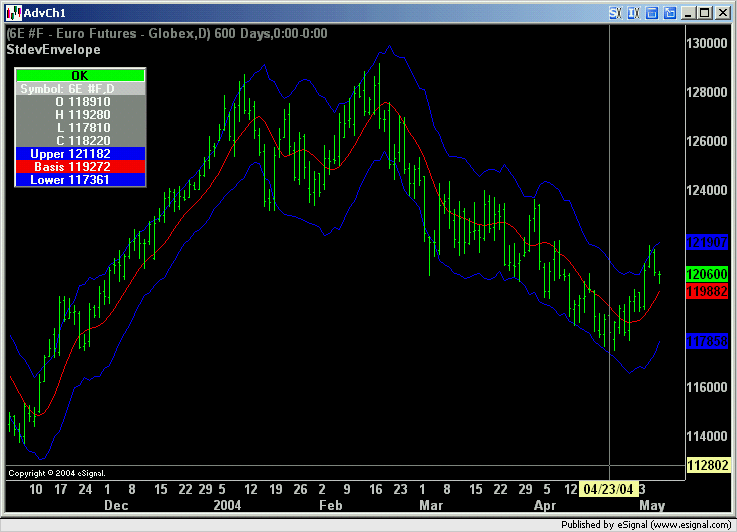
I spent the weekend looking over 100 some odd pages of posts but no luck.
This is what I'm hoping somebody has (because quite frankly I'm incapable of doing it myself currently).
The MEAN is a MA of MA of MA...this EFS is exactly like the EFS file found from ( Alexis' file I think) called Dema-Tema.efs. One can choose an exponential moving average, simple, etc. of either the close, HL/2 or HLC/3....etc.
The Bands are based on standard deviations of points similiar to the mean (ie. either close to close...or HL/2 or HLC/3..etc.) There is a constant factor that is user supplied to adjust the width of the bands such as 2.5 or 3.5 for 'standard deviations. I currently use this in TS: (Highest 3 day high + Lowest 3 day low)/2 as the points in calculating the standard deviation. This appears to provide a very robust band relative to market action.
I've attached the dema-tema.efs file for those interested.
Thanks for looking,
James


Comment