Announcement

Collapse
No announcement yet.

Building a Candlestick efs

Collapse
X
 
  • Filter
  • Time
  • Show
Clear All
new posts

  • #16
    Steve,

    I remember the one I think you are talking about, and I don't think it was candlessticks. I think it was an other indicator (like 3pt break) that someone wrote to overlay regular bars because of some of the issues in running a normal 3 pt break chart....

    Wish I could remember more details, but it was a good example of overlays.

    Garth
    Garth

    Comment


    • #17
      I found the link, here it is...

      http://forum.esignal.com/showthread....ars+AND+inside

      The efs was written by Chris Kryza and is available on the Divergence Software site.

      Comment


      • #18
        Query

        Hi Fibbgann

        Just wondering what those arrow indicators are on this
        chart , do they have any candlestick relationship ? I have been looking around here for an EFS that interprets candlestick
        patterns automatically .


        Dale

        Comment


        • #19
          steve
          the divergence study is close but not exactly what i am looking for he is using the high/low to produce his bars i am looking to use the open/close, it is certainly cheap enough but it is being sold as a study only package so i would not be able to adapt it,
          so the quest goes on,

          Comment


          • #20
            The big difference between the box study (Time Analysis) display and what will need to happen for a candle display is that you will be grouping each two candles as a single one...which means that you will have overlapping lines:

            Bar 1 & 2 - overlay A
            Bar 2 & 3 - overlay B

            But for bar 2, clearly here you have overlap on the A & B overlay. repeat across the chart and I think it will look a mess. If someone could come up with a clean way for this to look, I might take a SWAG at it.

            I'll give it more thought, but if anyone has any ideas on how to cleanly do this post em up. Or take a SWAG at it yourself.

            Garth
            Garth

            Comment


            • #21
              garth

              i was thinking more along the lines of

              bar 1 + 2 = overlay A
              bar 3 + 4 = overlay B
              bar 5 + 6 = overlay C
              bar 7 + 8 = overlay D

              and so on that way we are turning daily bars into two daily bars the only bug bear would be the high & low tails would be offset from each other but i could live with that,

              in reality i don't think you could go A,B,C,D etc as the variables would be huge but maybe have A & B skip over each other like this.

              bar 1 + 2 = overlay A
              bar 3 + 4 = overlay B
              bar 5 + 6 = overlay A
              bar 7 + 8 = overlay B

              just some thoughts i have been having.

              Comment


              • #22
                Not pretty but here is an idea on how to retrieve the OHLC over two bars
                Alex

                Attached Files

                Comment


                • #23
                  shogun,

                  That would make the display cleaner, but is the eqivalent of saying I will do candle charting only on every other bar. I really suspect to do what you want and have it have any sort of validity you would need continuous 2 bar candles and not alternate 2 bar candles.

                  Garth
                  Garth

                  Comment


                  • #24
                    Alex,

                    That would work, except it uses the alternative, instead of continuous 2 bar method.

                    But if everyone thinks alternative will work and give valid signals (I am highly skeptical), we could give it a shot.

                    If you think of it, when you do a 2 day bar what you are doing is a continuous two day bar, and not alternative 2 days. So this will not give the same results.

                    Garth
                    Garth

                    Comment


                    • #25
                      Variation on the prior efs with 2-day candles colored in lime or red depending if close is higher or lower than the open of two days ago
                      Alex

                      Attached Files

                      Comment


                      • #26
                        Grth
                        I am not sure about that in as much as it does not happen with a weekly chart of which this would be a sort of "shortened" version.
                        At least that is my understanding.
                        Alex

                        Comment


                        • #27
                          alex

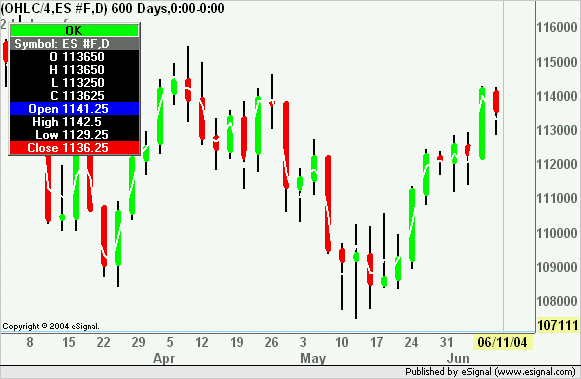
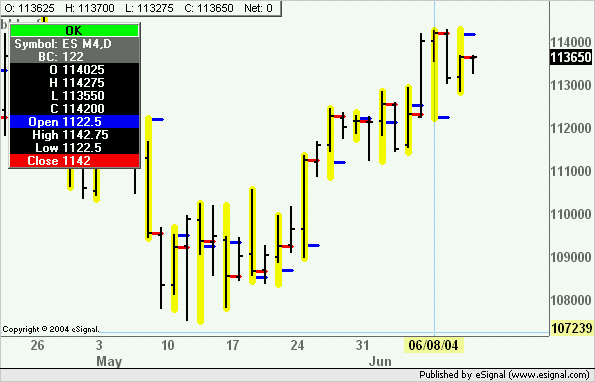
                          your a genius ,two day bars i was changing the colors but you beat me to is, i have also changed it slightly to make it into kind of a candle chart, the trouble is i am not sure how to get the chart to show on here, so below are the lines that i changed see what you think,


                          if(vCntr==2){
                          drawLineRelative(0,vOpen,1,vOpen,PS_SOLID,3,Color. blue,"Open"+vLineCntr);
                          drawLineRelative(0,vClose,1,vClose,PS_SOLID,3,Colo r.red,"Close"+vLineCntr);
                          drawLineRelative(0,vLow,0,vHigh,PS_SOLID,2,Color.b lack,"hilo"+vLineCntr);
                          if (vOpen < vClose){
                          drawLineRelative(0,vOpen,0,vClose,PS_SOLID,11,Colo r.lime,"opcl"+vLineCntr);
                          }else{
                          drawLineRelative(0,vOpen,0,vClose,PS_SOLID,11,Colo r.red,"clop"+vLineCntr);
                          }
                          }


                          it seems to work best if you change the original bar chart to a line chart & then change the line color to white ( or whatever your background color is), you can still see where the line crosses the 2 day candle but i think we will have to live with that,
                          Last edited by shogun; 06-11-2004, 01:53 PM.

                          Comment


                          • #28
                            garth

                            i think i know what you mean but if the candle was continuos it would surly just be the same as a 1 day bar, the idea for me to have a 2 day bar is as alex said a shortened version of the weekly bar , to be able to go up to the next time frame from the dailys ,the next step is to try and run a moving average from the data on the new 2 day bars,

                            Comment


                            • #29
                              Here it how it looks using the Line chart (I just thinned the vertical lines a bit)
                              Alex

                              Comment


                              • #30
                                Shogun,

                                It really wouldn't. Some data vendors do allow for two day bars (really x period bars), and it is done on a continuous basis.

                                Think about it. Mondays open will not be the same as tuesday's open. By alternating bars you leave tuesdays open price out of the picture entirely. With continuous the open will be represented. This is true for all of OHLC (though sometimes the H and L will be the same on a continuous bar basis).

                                Alex,

                                You are correct, weekly bars are done this way, but x-period bars typically are not.

                                In either case, as long as Shogun is happy...that's all that really matters. And it would be easy enough to change the code to do continuous if it ends up being needed.

                                Garth
                                Garth

                                Comment

                                Working...
                                X