Announcement

Collapse
No announcement yet.

Wilder's +/- DMI

Collapse
X
 
  • Filter
  • Time
  • Show
Clear All
new posts

  • Wilder's +/- DMI

    I'm trying to create an indicator based on the difference between Welles Wilder's +DMI and -DMI. I have created and used it in Metastock but as of now my efs abilities are limited to the wizard approach and I cannot see how to do this using the wizard. I've shown the formula code for Metastock below. I would also like to overlay an ema of this indicator (with periods as an input variable) in order to take signals generated by indicator/ema crossovers. Any guidance or help would be much appreciated.
    Thanks, Bill

    PDIPeriods:= Input("Enter The Number Of PDI Periods",1,100,14);
    MDIPeriods:= Input("Enter The Number Of MDI Periods",1,100,14);
    PDI(PDIPeriods)- MDI(MDIPeriods);
  • #2
    Bill
    FWIW this indicator can be written for the most part using only the Formula Wizard. The only part for which you would need to use the Editor is the return statement.
    If you consider that the EMA of the difference of +DMI and -MDI (called PDI and NDI in efs) is the same as the difference of the EMA of the +MDI and the EMA of -MDI you can then create the ADX study with the Formula Wizard and then using the study on study feature create also the individual EMAs of the +MDI and of the -MDI.
    Then using the Editor you write the two equations in the return statement one for the difference between the +DMI and -DMI and the other for the difference of the corresponding averages.
    As an example here is the study created along the lines explained above.
    First open it with the Editor to see how the return statement was put together then open it with the Formula Wizard to see how the studies were declared.
    The main drawback of this script is that the parameters can only be changed by editing the efs with the Editor. In a second message I will post also a user adjustable version of the study.
    Alex

    Attached Files

    Comment


    • #3
      Bill
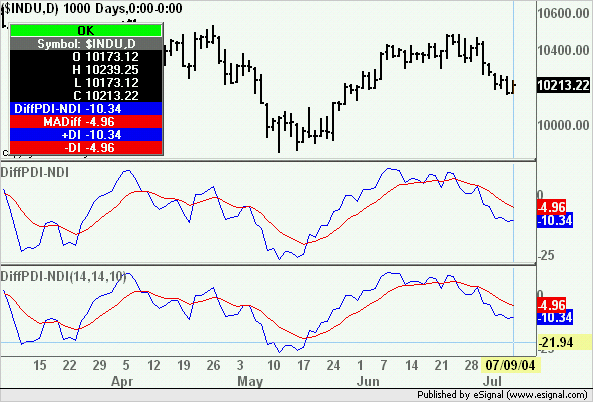
      Attached here is a version with user adjustable parameters for both the ADX and the EMA studies. The image below shows the two versions running.
      Alex

      Attached Files

      Comment


      • #4
        Alexis,
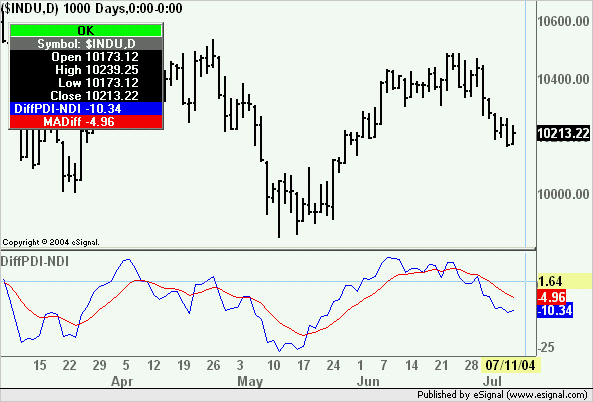
        Thank you very much for your help. The second one was exactly what I wanted. I added a "0" line which when crossed represents the actual crossings of the DMI lines. I hope others will find this a useful indicator. Again, thanks for your efforts.
        Bill

        Comment

        Working...
        X