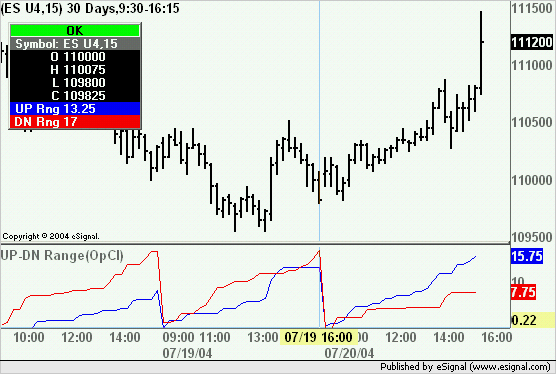
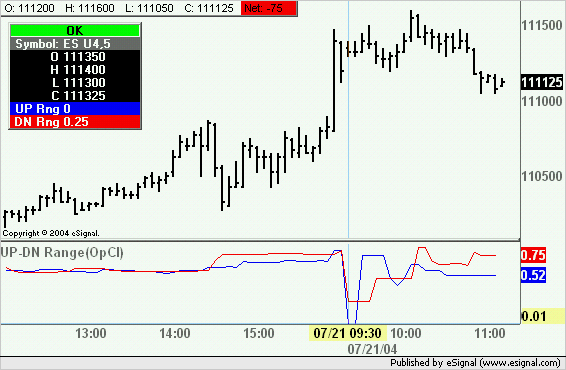
Is there an EFS that plots the cumulative average range of up bars vs down bars that starts at 9:30 (EST)?
If not, would someone be willing to code it?
It would be a good EFS to go along with the new "Up-Down Bar Counter" that Alex just wrote. (especially when using volume bars)
I am not sure if plotting the cumulative average range based on 'open to close' or 'high to low' data would be best. A parameter that would allow you use either would be nice. Any other suggestions are appreciated.
Thanks


Comment