 Tweet
Tweet
Hi guys,
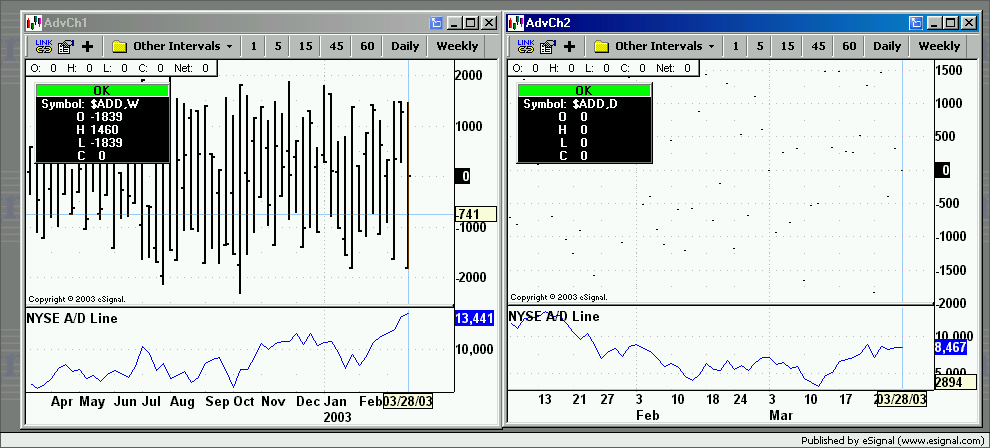
Is there a way to chart an intra-day advance decline line and put/ call ratio? I'd like to bring these up on an advanced chart if possible.
Thanks,
-pk
Is there a way to chart an intra-day advance decline line and put/ call ratio? I'd like to bring these up on an advanced chart if possible.
Thanks,
-pk


Comment