 Tweet
Tweet
Hi,
Quick question to see if anyone has dealt with this issue.
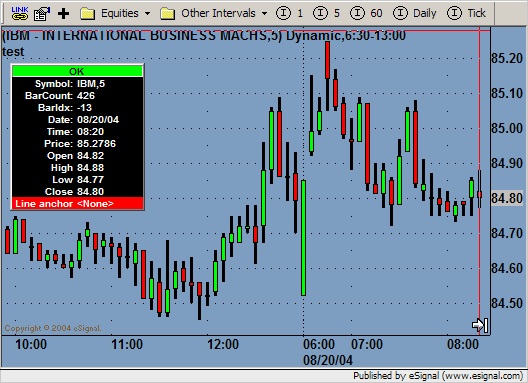
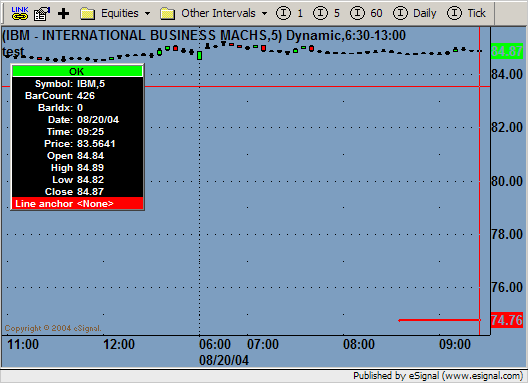
Using drawLineXXX() I draw lines on the chart to indicate signals and potential trend changes. Works great, but the issue is that sometimes due to the way the chart is scaled a line will be drawn "off screen", and I will not see it unless I turn off scaling and scroll the chart (which of course I wouldn't normally do...so in effect I never see the signal).
So, is there a method people have used to keep lines in the viewable chart?
This is similar to the AGET bug where lines that AGET draws are not visible on the chart...so even advanced studies have this problem...but it seems this should be able to be worked around.
Thanks for any ideas.
G
Quick question to see if anyone has dealt with this issue.
Using drawLineXXX() I draw lines on the chart to indicate signals and potential trend changes. Works great, but the issue is that sometimes due to the way the chart is scaled a line will be drawn "off screen", and I will not see it unless I turn off scaling and scroll the chart (which of course I wouldn't normally do...so in effect I never see the signal).
So, is there a method people have used to keep lines in the viewable chart?
This is similar to the AGET bug where lines that AGET draws are not visible on the chart...so even advanced studies have this problem...but it seems this should be able to be worked around.
Thanks for any ideas.
G
Comment