Announcement

Collapse
No announcement yet.

is there a higest high or lowest low function in e-sig

Collapse
X
 
  • Filter
  • Time
  • Show
Clear All
new posts

  • #16
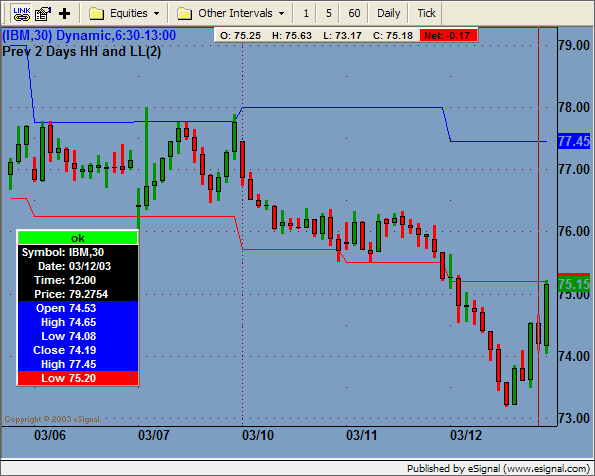
    I didnt draw the lines by hand, I calculated them and then drew them with an EFS.

    Apply this EFS to a 405 minute chart and the second on a chart interval of your choosing. See if it works for you. You may have to refresh the second chart if the Time Template is not currently active.
    Attached Files

    Comment


    • #17
      this is the second efs
      Attached Files

      Comment


      • #18
        I think you have to save the efs to Formulas first, then load it into the chart.

        Comment


        • #19
          Hello mclargo,

          Here is another solution for you to try. The following formula will give you the HH and LL from the previous 2 trading days as requested.

          PrevHHLL.efs

          This formula has an input parameter, nNumDays, which can be edited through the "Edit Studies" option. The default is set to 2.

          You will also need to download the following utility formula, getPrevDaysOHLC.efs, and save it to /Formulas/OHLC/. Your formula, PrevHHLL.efs, uses callFunction() on this formula, which returns the daily data for your HH and LL values. This formula returns daily OHLC data for a single value or an array of values, depending on the inputs you pass to it through the callFunction() function.

          Example:

          PHP Code:
          /***
            syntax:
            callFunction("filename.efs", "FunctionName", "PriceSource", "Offset", "NumDays");

            Where: 
            FunctionName is the name of the function within the formula (i.e.  "main()").

            PriceSource can be Open/High/Low/Close/Volume.

            Offset is a negative number, which will determine the last day in the array returned.

            NumDays is a positive number.  The number of days returned will include the Offset day 
            plus X days prior to that day. 

          ***/

          var aHighs callFunction("/OHLC/getPrevDaysOHLC.efs""main""High", -12);

          /***  returns

          aHighs[0] = High from 1 day ago.
          aHighs[1] = High from 2 days ago.

          ***/ 
          Jason K.
          Project Manager
          eSignal - an Interactive Data company

          EFS KnowledgeBase
          JavaScript for EFS Video Series
          EFS Beginner Tutorial Series
          EFS Glossary
          Custom EFS Development Policy

          New User Orientation

          Comment


          • #20
            this one stands alone and strips out all the extra stuff needed for the general case

            function preMain() {
            setPriceStudy(true);
            setStudyTitle("HHLL");
            debugClear();
            }

            function main() {

            vSymbol = (getSymbol() + ",405");

            vH1=getValueAbsolute("High", -1, 1, vSymbol)
            vH2=getValueAbsolute("High", -2, 1, vSymbol)
            vHH = Math.max(vH1,vH2);

            vL1=getValueAbsolute("Low", -1, 1, vSymbol)
            vL2=getValueAbsolute("Low", -2, 1, vSymbol)
            vLL = Math.min(vL1,vL2);

            return new Array(vHH,vLL);
            }

            Comment


            • #21
              David,

              I like the code, but how does efs know to look for daily abs high? does the code have to be used on daily bars to work?

              this is more of a learning question as i'm trying to figure out the ins and outs of efs

              thanks in advance

              Comment


              • #22
                Jason,

                I can not get your code to give the right highest high and lowest low for the past two days.

                See pic attached
                Attached Files

                Comment


                • #23
                  MC

                  vSymbol = (getSymbol() + ",405");

                  vH1=getValueAbsolute("High", -1, 1, vSymbol)

                  tell the program to get the value of the high from yesterday's 405 min chart

                  then it gets the high from -2 days ago and compares which is higher with the math.max stmt.

                  Procedure is repeated for the low and then the HH an LL are returned for plotting.

                  Will work on any interval, I used 5 min for testing.

                  Comment


                  • #24
                    Hello mclargo,

                    My apologies for the inconvenience. The file I uploaded last night wasn't the most current version of the formula. Please download the corrected version and try again.

                    getPrevDaysOHLC.efs
                    Jason K.
                    Project Manager
                    eSignal - an Interactive Data company

                    EFS KnowledgeBase
                    JavaScript for EFS Video Series
                    EFS Beginner Tutorial Series
                    EFS Glossary
                    Custom EFS Development Policy

                    New User Orientation

                    Comment


                    • #25
                      Jason,

                      The code works now, many thanks. Maybe this thread can finally retire in dignity

                      Comment


                      • #26
                        David,

                        Thanks for the explaination. I'm going to need some time to mull this all over, but the good thing about your code is, it is much cleaner than Jason's submission.

                        MC

                        Comment


                        • #27
                          Previous Day High and Low

                          How can I get this to work for backtesting? Using

                          PHP Code:

                          vSymbol 
                          = (getSymbol() + ",D");
                          vPDHi getValueAbsolute("High", -11vSymbol);
                          vPDLo getValueAbsolute("Low", -11vSymbol); 
                          gets one value and uses it throughout instead of getting the previous day's high and low for each day being computed.

                          Thanks

                          Comment


                          • #28
                            Whenever I have problems with ,d I try ,405 or ,390 - sometimes that clears up the issue.

                            Comment


                            • #29
                              i got the same result with a different interval (i also tried 405). i'm using a 2 minute chart and backtesting over 20 days. it gets the high and low from the day before the most recent (the current day) and it uses the same results back through time.

                              thanks.

                              Comment


                              • #30
                                I am not sure why you are getting those results, but if you look at PreviosDaDailyBars on OHLC im Formulas, you might see a way.

                                That efs seems to work on a 5 min chart during replay mode.
                                Attached Files

                                Comment

                                Working...
                                X