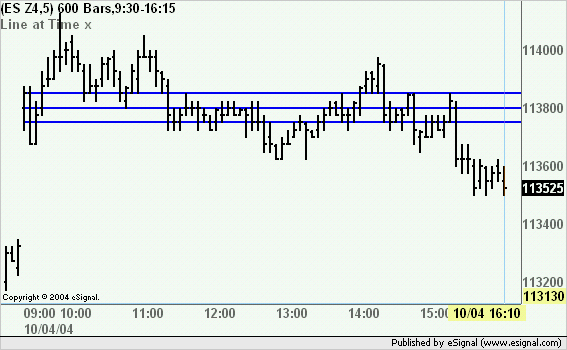
Hi Alex, your "Line at Time x" is working great! I want to have more lines drawn using this line as a base:
Once "line at time x" is drawn, to draw horiz lines above and below. I can do this manually with lineslabels.efs but I must input the actual prices. I only want to specify +/- increments with a maximum value, vs the "line at time x".
Examp: if "line at time x" is drawn at 20.00 and I specifiy increments of (+/-).50 with a maximum value of (+/-)2.00, the hi lines are drawn at 20.50, 21.00, 21.50 and 22.00; the lo lines are drawn at 19.50, 19.00, 18.50 and 18.00.
Are there exisiting studies which could be modified to do this, i.e. lineslabels(vs 2.0), roundnumberlines, srlines(1-2)? I really appreciate your time and expertise. Thanks again. Steve

Comment