Announcement

Collapse
No announcement yet.

debugging

Collapse
X
 
  • Filter
  • Time
  • Show
Clear All
new posts

  • debugging

    I use C# (and several other languages) in my code development and they have plenty of debug tools like breakpoints etc. where you can examine values.

    I'm really struggling to debug some EFS script and the only tool that I can find is debugPrintln() and I've been using that everywhere but it's fairly limited and I'm looking for something more useful.

    Is there a thread or link or resource for debugging tips for EFS scripts / java scripts?

    The problem that I'm experiencing is that the script appears to prematurely abort certain functions and return to the calling function unexpectedly without any reason to do so. I'm trying to track down this reason. Any help here as well?

    Many thanks.
    Standing on the shoulders of giants.

  • #2
    Hello wildfiction,

    Currently, the debugPrintln() function is the only debugging tool for EFS. To help you pin point the problem area in your code, start with a single debugPrintln() statement at the top of main(). Use something like this,

    debugPrintln(getCurrentBarIndex());

    This will show you all the bars your code processed when you reload the formula. Run the formula and see if anything prints to the Formula Output Window (FOW). If it does, clear the FOW, move your debug statement down in the order of process to another logical point and run the formula again. Keep moving the debug statement further down in the order of process until nothing prints in the FOW. This process will help you narrow down the problem code. Once you've identified the line that is causing the formula to break, move your debug statement to the line just above it and start scrutinizing the functions and data that are being used in the problem line of code. Build some strings using your variables or what have you in the debug statement. For example,

    debugPrintln("Index: " + getCurrentBarIndex() + " myVar: " + myVar);

    If you find that line of code and post it here, I might be able to give you some ideas of what to do if it doesn't become obvious to you.
    Jason K.
    Project Manager
    eSignal - an Interactive Data company

    EFS KnowledgeBase
    JavaScript for EFS Video Series
    EFS Beginner Tutorial Series
    EFS Glossary
    Custom EFS Development Policy

    New User Orientation

    Comment


    • #3
      I asked a bit ago if there were any plans of implementing the netscape javascript debugger, and received no answer. This would be nice to have. You can (eventually) debug just about anything using debugPrintln(), but it sure is slow and painful going sometimes.
      Garth

      Comment


      • #4
        wildfiction
        You may also want to try Steve Hare's "trace" function which you can find in this thread
        Alex

        Comment


        • #5
          Thanks for all the help and the pointers.

          I had already isolated the 2 lines that were causing the problem before I posted this message using a medly of the methods that you described.

          So on to the problem:

          the line of code is:

          var val = getValue(source, 0, 1, oSymbol);

          source is set to one of "close", "low", "high"
          oSymbol is set to another symbol that is different from the one being plotted.

          So what happens is that line is hit and then the main() function returns without processing any other lines.

          After further analysis I have isolated when the problem happens:

          It happens when I'm using a 1 minute chart and the symbol being charted (say ES) have a bar (and hence prices) for every minute during the period being watched.

          The other symbol (oSymbol - let's say "nq #f") has a missing bar during one of the minutes over the watched time frame.

          If the function didn't just kick out at this point (i.e. return) then I'd at least be able to check for null but no such luck.

          Any ideas?
          Standing on the shoulders of giants.

          Comment


          • #6
            An idea, try to obtain the data as an array like this

            var val = getValue(source, 0, 4, oSymbol);

            maybe that will return a null value for val[0] in the situation you described

            Comment


            • #7
              Originally posted by stevehare2003
              An idea, try to obtain the data as an array like this

              var val = getValue(source, 0, 4, oSymbol);

              maybe that will return a null value for val[0] in the situation you described
              That's exactly what I was trying to do and then I could iterate through the array and find the first non-null value which would work perfectly.

              The problem is that the next line of the code is never hit so I can't even look for null values. The function just returns after I call getValue().
              Standing on the shoulders of giants.

              Comment


              • #8
                wildfiction,


                This may or maynot help...

                I ran into something similar twice now and it drove me crazy the first time. As it ended up it wasn't the call I thought it was that was causing the error (though that is where execution of the EFS ended). What was causing the problem was that I had an improperly formatted math function up higher in my code. I corrected that math function and everything worked.

                I never did figure out why the EFS didn't bomb out on the math function (I was either the floor, the abs or the power function - forget which now) and why it caused an error later on my call to close().

                Best guess was that I was munging my array somehow (and maybe stomping on addresses I shouldn't have).

                Garth
                Garth

                Comment


                • #9
                  wildfiction
                  An alternative solution you may want to try to sync the symbols is the following (this example assumes you are plotting ES in the chart and NQ in the efs).
                  As the symbol for the price chart use ES #F +NQ #F -NQ #F and in the efs you use
                  getValue("Close",0,"nq #f +es #f -es #f");
                  You are actually plotting only ES #F in the chart since the NQ #F symbols cancel each other out but if there is a zero volume bar the chart will still plot that timestamp if there is a tick in NQ. The same happens in the efs with the net effect that the two symbols are synced. The drawback is that the chart will replicate the last bar when no ticks occurr in the main symbol
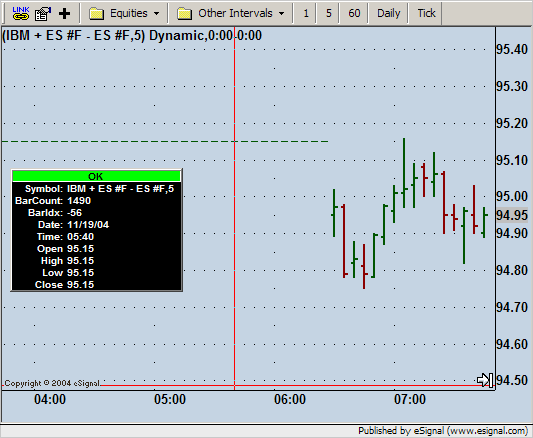
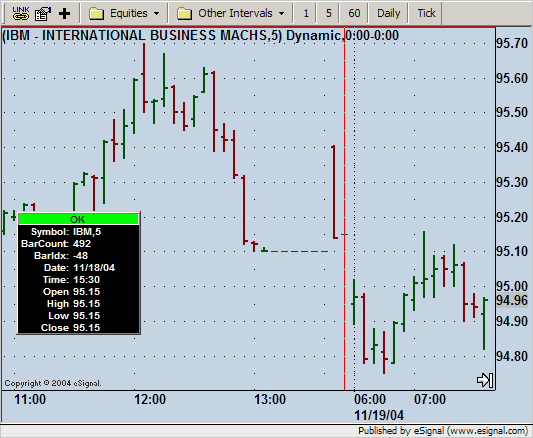
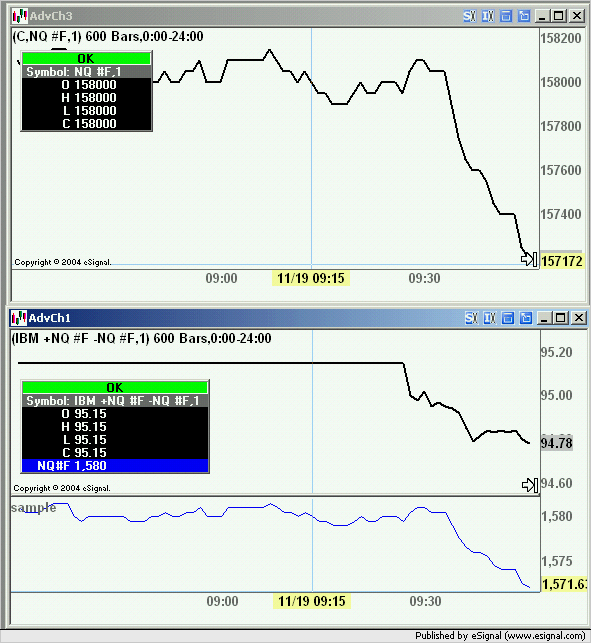
                  In the image below I used IBM and NQ #F and as you can see the NQ plot in the efs is synced to the NQ chart at a time in which they would otherwise be out of sync.
                  Note however that I have not extensively tested this solution
                  Alex

                  Comment


                  • #10
                    Originally posted by gspiker
                    I never did figure out why the EFS didn't bomb out on the math function (I was either the floor, the abs or the power function - forget which now) and why it caused an error later on my call to close().

                    Best guess was that I was munging my array somehow (and maybe stomping on addresses I shouldn't have).
                    Thanks Garth,

                    I went through the EFS and changed all the Math functions into if...then constructs and checked the values but still no joy. Not having a debugger and being able to see the values is really frustrating...

                    You've given me an idea that it's something else in the code higher up that's causing the problem. I'll go through it and check again. Thanks for the input. Much appreciated.
                    Standing on the shoulders of giants.

                    Comment


                    • #11
                      Originally posted by Alexis C. Montenegro
                      ...As the symbol for the price chart use ES #F +NQ #F -NQ #F) and in the efs ...

                      The drawback is that the chart will replicate the last bar when no ticks occurr in the main symbol
                      Thanks Alexis! That solves the problem - works like a charm.

                      I don't understand why the last bar would be replicated if there is no tick in the main symbol on a (say 1 minute) bar?
                      Standing on the shoulders of giants.

                      Comment


                      • #12
                        Hello wildfiction,

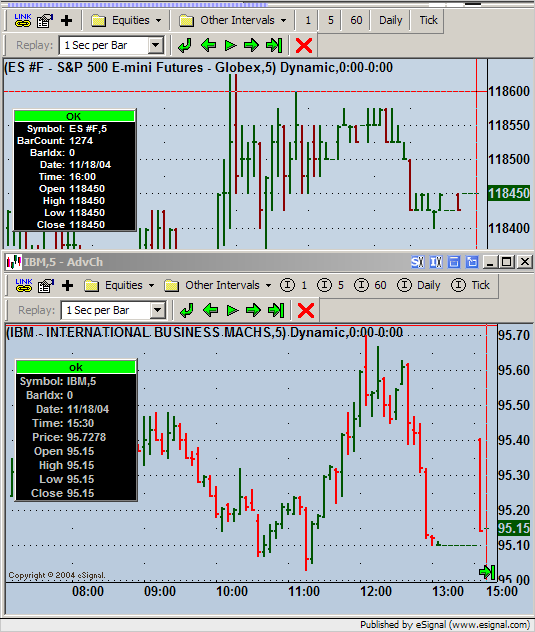
                        For this explanation, lets refer to the replicated bars through the night on the IBM + ES #F - ES #F with a 24-hour time template on a 5 minute chart.


                        The reason we get these replicated bars is because a spread chart works similar to EFS in how it refers to the relative bar indexes of the two symbols. First look at IBM on a 24-hour time template.


                        IBM's last trade yesterday was at 15:30 (PST) at 95.15. There are no more trades on IBM until 6:30 the next day. For ES #F on the 24-hour time frame, there are trades throughout the night session. So as the chart is loading and we are processing the 16:00 bar, which would be the bar index of 0 at that point. The chart goes and gets the current 0 bar value for IBM, which is still the 15:30 bar on the IBM,5 chart where the close was 95.15. So when we add and subtract ES #F 16:00 (bar 0 on ES #F,5) price we are left with 95.15 plotted on the 16:00 bar for the spread of IBM + ES #F - ES #F.


                        And so on throughout the night until 6:30 the next day when IBM starts trading again, which creates IBM's new 0 bar on the IBM,5 chart. Did this help answer your question?

                        Alex, by the way, great discovery on using the spread symbol here to synchronize the prices of two different symbols. Very ingenious.
                        Jason K.
                        Project Manager
                        eSignal - an Interactive Data company

                        EFS KnowledgeBase
                        JavaScript for EFS Video Series
                        EFS Beginner Tutorial Series
                        EFS Glossary
                        Custom EFS Development Policy

                        New User Orientation

                        Comment


                        • #13
                          That does make sense. Many thanks for the explanations and help guys!
                          Standing on the shoulders of giants.

                          Comment


                          • #14
                            wildfiction
                            After having run some tests I believe you can use a slightly revised (and simplified) version of the solution I suggested earlier in this thread.
                            For the symbol in the chart instead of using the expression ES #F +NQ #F -NQ #F try using ES #F +0.00NQ #F and in the efs replace getValue("Close",0,"nq #f +es #f -es #f"); with getValue("Close",0,"nq #f +0.00es #f");
                            The results should be identical.
                            Alex

                            Comment


                            • #15
                              Originally posted by Alexis C. Montenegro
                              wildfiction
                              After having run some tests I believe you can use a slightly revised (and simplified) version of the solution I suggested earlier in this thread.
                              For the symbol in the chart instead of using the expression ES #F +NQ #F -NQ #F try using ES #F +0.00NQ #F and in the efs replace getValue("Close",0,"nq #f +es #f -es #f"); with getValue("Close",0,"nq #f +0.00es #f");
                              The results should be identical.
                              Alex
                              Hi Alex and anyone else reading this thread.

                              Not sure about your final solution Alex but the original one that you suggested works great up to eSignal 7.8 and fixes the problem in those versions of eSignal.

                              If you've installed eSignal 7.9 then you can (in my case you MUST remove this or the EFS stops working) remove this work around as it looks like eSignal 7.9 addresses the original problem. In addressing the original problem 7.9 breaks the work around (at least it does for my code). But the good news is that by removing the work around the code appears to run fine - so far.

                              Thanks for the help everyone.
                              Standing on the shoulders of giants.

                              Comment

                              Working...
                              X