Announcement

Collapse
No announcement yet.

High/low Lines

Collapse
X
 
  • Filter
  • Time
  • Show
Clear All
new posts

  • High/low Lines

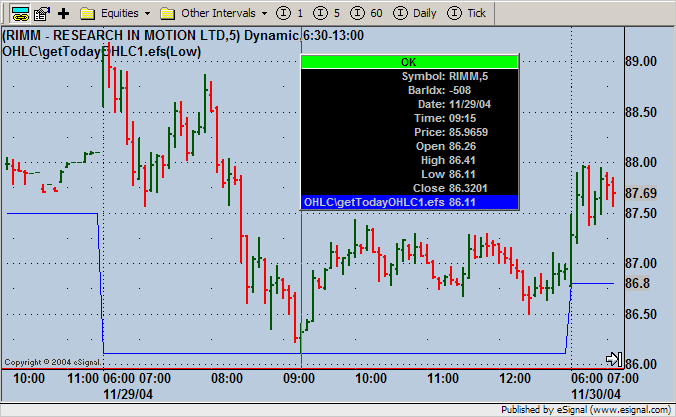
    I am using a study which updates that day's high/lows by drawing horiz lines. It reads pre-marktet activity which I don't need. Also the lines seems to get "stuck" on premarket high/low prices and don't adjust intraday. If there is no premarket trading then it works fine. The main study is "TodaysHighLow", which needs a helper file called "getTodayOHLC1." I have attached the first one and will send the other as needed.

    Can someone plz show me how to recode so that the data only is read from the actual opening at 6:30 PST. I don't know if one or both of these studies needs to be modified.

    Thanks and good trading.

    Steve
    Attached Files

  • #2
    Hello Steve,

    Try adding the follow line as the first line in main. This will prevent the study from executing your code until it sees the 06:30 bar.

    if (getHour()*100 + getMinute() < 630) return;
    Jason K.
    Project Manager
    eSignal - an Interactive Data company

    EFS KnowledgeBase
    JavaScript for EFS Video Series
    EFS Beginner Tutorial Series
    EFS Glossary
    Custom EFS Development Policy

    New User Orientation

    Comment


    • #3
      Hello Steve,

      After a second look I realized you need to make another modification to main. Change the beginning of main to look like the following and you should be good to go.

      PHP Code:
      function main() {
          if (
      getDay() != getDay(-1)) vHigh null;
          if (
      getHour()*100 getMinute() < 630) return;    
          if (
      vHigh == null) {
              
      vHigh high();
              
      vLow low();
              
      x1 getCurrentBarIndex();
          } 
      Jason K.
      Project Manager
      eSignal - an Interactive Data company

      EFS KnowledgeBase
      JavaScript for EFS Video Series
      EFS Beginner Tutorial Series
      EFS Glossary
      Custom EFS Development Policy

      New User Orientation

      Comment


      • #4
        Jason, this works great. Thanks!

        Steve

        Comment


        • #5
          Jason, todayshighlow.efs is working okay using the mkt open time you helped me with. But there's a problem on the low line which is drawn at a "random" price nowhere near the actual price. Examp: at today's open, RIMM @ 6:31 (PST) had actual low of 88.50 but line was at 87.56 and there were no marks anywhere near there, i.e. a bad tick or a "mini" bar. This is only on the low line and the high line seems perfect. When I reload the formula, the low line is drawn in the proper place. This study also uses a "helper" file called gettodayOHLC1. Any ideas?

          Thanks, and hope you had a great Thanksgiving.

          Steve

          Comment


          • #6
            Hello Steve,

            The getTodayOHLC1.efs looks at the daily interval to get the corresponding price. It's possible that there was a bad tick stored on the daily interval that caused the discrepancy. However, I'm looking at the 29th with getTodayOHLC1.efs and I'm not seeing a problem. Perhaps I'm looking at a different day than you. Please clarify the details related to which day you were looking at and post some chart images if you still have a problem with your formula.

            Jason K.
            Project Manager
            eSignal - an Interactive Data company

            EFS KnowledgeBase
            JavaScript for EFS Video Series
            EFS Beginner Tutorial Series
            EFS Glossary
            Custom EFS Development Policy

            New User Orientation

            Comment


            • #7
              Hi Jason, the main study I'm using is "TodaysHighLow" which I've attached. This needs a helper study called
              "getTodayOHLC1" which I'll send. I have snapshots of 2 examps which I'll also send you. With all my charts I have tick filters with different colors "ON", so bad ticks will show.

              Plz let me know what you find. Thanks again for your help.

              Steve

              P.S. 3 more attachments to follow...........

              P.S.S. Is there any way to send more than one attachment simultaneously?
              Attached Files

              Comment


              • #8
                HELPER STUDY

                This is the helper study I'm using: "getTodayOHLC1".
                Attached Files

                Comment


                • #9
                  SNAPHOT-Open Price Line

                  Stock is ASKJ on 12/8/04:

                  Actual (aqua X) 26.71 @ 6:30:02
                  Study (pink line) 27.10 @ 6:30:50

                  I tested several "open lines" and all pink lines started about 1 minute after actual stock opening, regardless of prior bars during that first minute.
                  Attached Files

                  Comment


                  • #10
                    SNAPSHOT-Low Price Line

                    Stock is EBAY on 12/9/04:

                    Actual (aqua X) 113.74 @ 6:31:10
                    Study (red line) 113.36 @ mkt open

                    No visible ticks anywhere near the red line.
                    Attached Files

                    Comment


                    • #11
                      Hello smart1,

                      Thank you for posting your code and chart images. The reason your code was showing lower lows than the corresponding daily bar was because you are using a Math.min() routine where one of the inputs is a global variable, vLow, which was not getting reset for each new day. Since you weren't doing that, vLow was recording the lowest low from all days loaded in your chart. Replace line 14 (first line in main) with the following code and you should be good to go.

                      PHP Code:
                      if (getDay(0) != getDay(-1)) {
                          
                      vHigh null;
                          
                      vLow null;

                      Your new result should now look like this.
                      Jason K.
                      Project Manager
                      eSignal - an Interactive Data company

                      EFS KnowledgeBase
                      JavaScript for EFS Video Series
                      EFS Beginner Tutorial Series
                      EFS Glossary
                      Custom EFS Development Policy

                      New User Orientation

                      Comment


                      • #12
                        Steve,

                        By the way, you can't post multiple attachments to a single post. What you can do is create a file share group, upload multiple images and files there and then reference as many files and images in a single post using their file share URLs as you want with the HTTP and IMG options when replying in the forums.
                        Jason K.
                        Project Manager
                        eSignal - an Interactive Data company

                        EFS KnowledgeBase
                        JavaScript for EFS Video Series
                        EFS Beginner Tutorial Series
                        EFS Glossary
                        Custom EFS Development Policy

                        New User Orientation

                        Comment


                        • #13
                          Jason, thanks for the info. The intraday Hi/Lo lines are now more accurate and they adjust automatically during the trading day. I still have a problem with the open price line. I've checked several stock charts and the open line always starts at 6:30:50, even though there are price bars reflecting trading activity during that first minute (I'm using 10S intervals).

                          I've included a snapshot for RIMM: the aqua "x" marks the actual opening at 82.33 (6:30:00), and the pink line from the study marks the price at 81.93 (6:30:50). As you can see it gets a late start which happens on all charts. Also the high (green) and low (red) lines begin at precisely 6:30:00 (they're way off because I took the snapshot later in the trading day and the red/green lines don't change when manually navigating backwards in time on the chart).

                          Is it possible to code it so the open price line is drawn at the open price of the first bar after 6:30:00? If this can be done it would more closely match the actual "open price" shown on my quote/trading platform (MBTrading). I'll send you the revised code immediately after this.

                          Thanks for your help,

                          Steve
                          Attached Files

                          Comment


                          • #14
                            Here's the study which I've revised as per your latest thread.
                            Attached Files

                            Comment


                            • #15
                              OOPS!!

                              Jason, the high/low lines for intraday work great on todayshighlow study so thanks for fixing that.

                              Re: the open price line I use another study for that called lineattimex. I'm sorry cause I screwed up and did not send this to you with my original request. I've attached the study and plz see line 46: the condition calls for a specific time to plot the line. What's happening is that it starts before 630 and I'll send you a snapshot. I've tried coding: =630, >630, >=630 but get syntax errors.

                              What I want is the line to be drawn using the actual opening price of the first bar at 630 or later because sometimes stocks don't trade for a few minutes. So, whether a stock opens exactly at 630, or at 634, the line will be drawn at the opening of that bar.

                              I guess this is fairly elementary but plz hang in there with me cause I'm still a noobie. Thanks for your help.

                              Steve
                              Attached Files

                              Comment

                              Working...
                              X