Announcement

Collapse
No announcement yet.

Price relative to MA?

Collapse
X
 
  • Filter
  • Time
  • Show
Clear All
new posts

  • Price relative to MA?

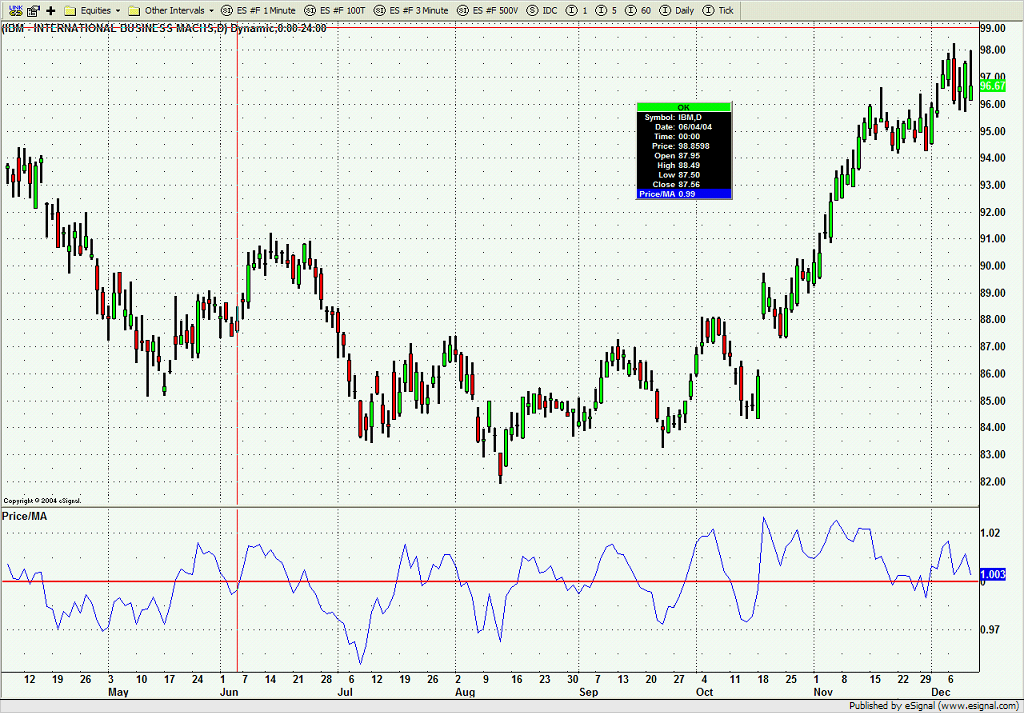
    Is there an EFS that will plot a line representing price relative to a moving average in the main window. For those familiar, this concept is like Adam Hamiltons work with gold and the dollar. I would prefer to see only the relative line in the main window which I think can be accomplished as well. If there isn't such a study available could somebody link to a study I might modify? I have played around with the EFS editor but have come up short so far and still need a little guidance.

    TIA

  • #2
    Would you like the price and MA both represented as lines? If so, select an advanced chart as a line chart (circled in red)


    Then add in a Basic MA.

    I hope this helps.

    Comment


    • #3
      Thanks for the reply. I think I need to clarify though. What I am wanting is a single plot that represents the price divided by a moving average against a scale which is baseline 1.00 when the two numbers are equivalent. Gold is a good example. Spot closed at around $435 Friday and its 200 Day MA is 411. 435 / 411 = 1.058 which is the plot point I would want. What this does is give you a gauge of how far price is trending away from its MA so it is another way of measuring overbought and oversold situations.

      Comment


      • #4
        Ok, thanks for the clarification, I modified the basicMA efs to calculate the ratio in addition to adding a red line at 1.0.


        You can adjust all the parameters associated with the moving average using edit studies (accessable by right clicking the chart)

        Attached is the efs, hope this works out for you.
        Attached Files

        Comment


        • #5
          Excellent. I was real close but was suffering from some scaling problems and trying to display it in the price pane. I have it turned around now and working as a lower study. I would still like to overlay the price pane with it but it is causing some undesirable effects. I need to play with that a bit more. Thanks for your help!

          Comment


          • #6
            rgmullen,

            You are most welcome. To overlay, with your mouse on the lower pane, hold down the shift key and drag it onto the price pane.

            Comment


            • #7
              Thanks, I have gotten it to work that far. I then set it to display to the left and scale on the left which is my desire. The problem is that I would like to be able to control the max scale shown on the left as well as the min and the center point (the 1.0 line). I have played around with setStudyMin() and setStudyMax() but they don't do quite what I expect. I just need to figure out how to get fine grained control of this scale and all will be aces.

              A bit frustrating but a fun challenge so far.

              Comment

              Working...
              X