 Tweet
Tweet
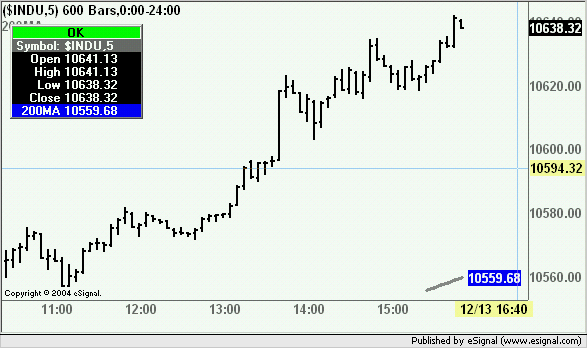
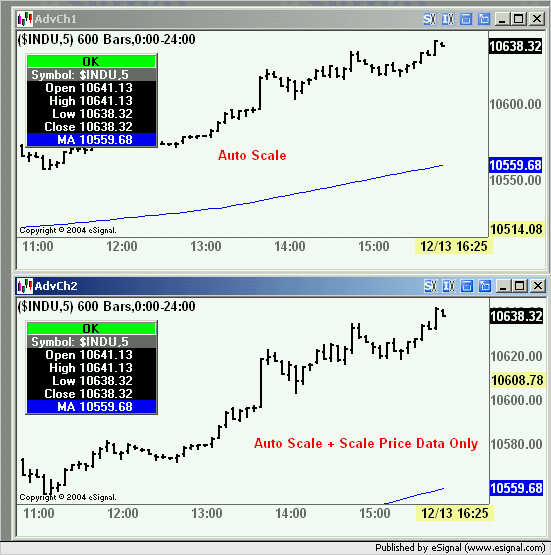
Using the 200 Moving Average sometime shrink the charts depending how far the 200MA is located, Also trying to minimize the number of lines running horizontally. With this code it display the last 5 places where the 200MA is and it will not shrink the chart. I also like to use auto scaling.
The problem is since I'm not returning any value nothing is displayed in the cursor window or in the right hand side of the chart. is there any way that can be done?
var vMA1 = null;
var BarCntr = 0;
function preMain() {
setPriceStudy(true);
setStudyTitle("200MA");
setCursorLabelName("200MA", 0);
setDefaultBarStyle(PS_SOLID, 0);
setDefaultBarThickness(2, 0);
setPlotType(PLOTTYPE_LINE, 0);
var fp1 = new FunctionParameter("MA1Length", FunctionParameter.NUMBER);
fp1.setLowerLimit(1);
fp1.setDefault(200); //Edit this value to set a new default
var fp2 = new FunctionParameter("MA1Offset", FunctionParameter.NUMBER);
fp2.setDefault(0); //Edit this value to set a new default
var fp3 = new FunctionParameter("MA1Source", FunctionParameter.STRING);
fp3.setName("MA1Source");
fp3.addOption("Close");
fp3.addOption("High");
fp3.addOption("Low");
fp3.addOption("Open");
fp3.addOption("HL/2");
fp3.addOption("HLC/3");
fp3.addOption("OHLC/4");
fp3.setDefault("Close"); //Edit this value to set a new default
var fp4 = new FunctionParameter("MA1Type", FunctionParameter.STRING);
fp4.setName("MA1Type");
fp4.addOption("MAStudy.SIMPLE");
fp4.addOption("MAStudy.EXPONENTIAL");
fp4.addOption("MAStudy.WEIGHTED");
fp4.addOption("MAStudy.VOLUMEWEIGHTED");
fp4.setDefault("MAStudy.SIMPLE"); //Edit this value to set a new default
}
function main(MA1Length,MA1Offset,MA1Source,MA1Type) {
if (getBarState() == BARSTATE_NEWBAR) {
BarCntr += 1;
}
if (vMA1 == null) vMA1 = new MAStudy(MA1Length, MA1Offset, MA1Source, eval(MA1Type));
if (BarCntr > MA1Length) {
drawLineRelative(-1, vMA1.getValue(MAStudy.MA,-1), 0, vMA1.getValue(MAStudy.MA,0), PS_SOLID, 3, Color.grey, 0 );
drawLineRelative(-2, vMA1.getValue(MAStudy.MA,-2), -1, vMA1.getValue(MAStudy.MA,-1), PS_SOLID, 3, Color.grey, 1 );
drawLineRelative(-3, vMA1.getValue(MAStudy.MA,-3), -2, vMA1.getValue(MAStudy.MA,-2), PS_SOLID, 3, Color.grey, 2 );
drawLineRelative(-4, vMA1.getValue(MAStudy.MA,-4), -3, vMA1.getValue(MAStudy.MA,-3), PS_SOLID, 3, Color.grey, 3 );
drawLineRelative(-5, vMA1.getValue(MAStudy.MA,-5), -4, vMA1.getValue(MAStudy.MA,-4), PS_SOLID, 3, Color.grey, 4 );
}
}
Thank you
Ketoma
Attached Files
Comment