Announcement

Collapse
No announcement yet.

constant scaling?

Collapse
X
 
  • Filter
  • Time
  • Show
Clear All
new posts

  • constant scaling?

    Is it possible to configure or program the charts so that they have a constant scaling? Setting this by hand, with the pointer, isn't precise enough.

    In searching the archives & finding a suggestion, I tried changing from the defaults of Edit Studies, Display/Scale Right to No Display/Scale, and when I attempted to change back to the default values, price calculations disappeared & went into some type of endless loop, taking 100% of CPU, requiring a Task Manager Kill Task.

    Thanks for any constant scaling suggestions.
  • #2
    Hello gpfx19,

    If you go to Chart Options --> Scaling and unselect all scaling options, does that create the constant scaling you're looking for?
    Jason K.
    Project Manager
    eSignal - an Interactive Data company

    EFS KnowledgeBase
    JavaScript for EFS Video Series
    EFS Beginner Tutorial Series
    EFS Glossary
    Custom EFS Development Policy

    New User Orientation

    Comment


    • #3
      Hi Jason,

      No, that doesn't do it. To be more explicit in what I am looking for, let's use ES as an example. I would like each full point (1.00) to be, say, 20 pixels tall. This would then permit me to look at any chart & see the same thing, making a quick scan that much quicker. As an additional benefit, it would also remove the problem of of having an ES chart drop to a scale of tenths (analoguous issue with NQ).

      Thanks,
      Greg

      Comment


      • #4
        I have a differnet take on how to show a constant distance for a given price move...

        Draw a line at the low of the last x bars

        Draw anoher line at the low of the last x bars plus some y value, say 20 pts.

        This way you could see a 20 point range at all times and the price action would be scaled into that range.

        Comment


        • #5
          David,

          Great idea! In doing this, I then just make all the lines align vertically, and I am set.

          Thank you!
          Greg

          Comment


          • #6
            Actually, that is a good start, as long as I do not change securities. When I look at a different instruemnt, then return, I am back to the scaling problem.

            Comment


            • #7
              Hello Greg,

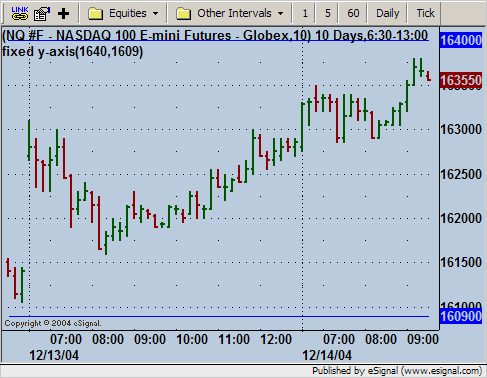
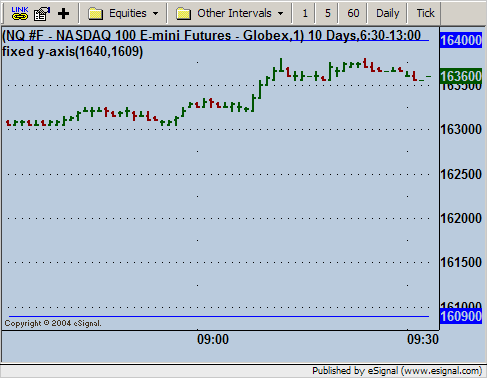
              We don't have a scaling option that does what you need. David's solutions sounds like a good one. You could also use an EFS that takes two user inputs and draws the lines at two values that would force the y-axis to be fixed so that all charts of NQ with different intervals will be using the same y-axis range. The two values need to be set far enough outside the price range of the chart symbol for this to work. If you want to use the same values for multiple symbols and intervals then the values need to be outside the max and min price range for all symbols you wish to view. The EFS would need to be applied to all charts. Try the code below.

              PHP Code:

              function preMain() {
                  
              setPriceStudy(true);
                  
              setStudyTitle("fixed y-axis");
                  
              setShowCursorLabel(false);
              }


              var 
              bEdit true;
              var 
              nTop null;
              var 
              nBottom null;
               
              function 
              main(TopBottom) {
                  if (
              bEdit == true) {
                      
              nTop Top;
                      
              nBottom Bottom;
                      
              bEdit false;
                  }
                  
                  return new Array(
              nTopnBottom);


              Jason K.
              Project Manager
              eSignal - an Interactive Data company

              EFS KnowledgeBase
              JavaScript for EFS Video Series
              EFS Beginner Tutorial Series
              EFS Glossary
              Custom EFS Development Policy

              New User Orientation

              Comment


              • #8
                Greg

                If a fixed separation is a hassle when you change symbols, maybe a percentage increase off the low would be more appropriate.

                Comment


                • #9
                  Jason, David -

                  You have given me enough information that I can program the rest.

                  Jason, from the framework you have been kind enough to share, I can take code I have already writtten (if symbol = ES, else...), but I would still need to enter values. David, your last remark gives me ideas on where to acquire those values.

                  Thank you gentlemen,
                  Greg

                  Comment


                  • #10
                    SCALING

                    Jason, I use one chart window for each different stock and I'm trying to get consistency in the right-margin scaling. This way when the price action changes the scale increments should remain the same. It sounds like that's what Greg (gpfx19) is trying to do. Apparently the eSignal advanced chart software cannot do this yet so will this study do what I'm describing?

                    On your 12/14 thread to Greg you attached 2 chart examps of the same stock (NASD 100 E-Minis), but will this work for different stocks. Also, when I loaded this study I got a syntax error: "line 2, syntax error, missing ; before statement: setPrice Study (true);". As you can see, there is a ";" on line 2. I tried deleted and reentering but that didn't work.

                    Again, I greatly appreciate your input and ideas.

                    Steve

                    P.S. I'm using a "volume clipping" study which keeps the volume scale constant on all charts. If volume spikes above my default amount it keeps the vertical space the same. Could the theory in this study also apply to the right-margin spacing?

                    Comment


                    • #11
                      Hello Steve,

                      Yes, this study should do the trick for you with different stocks. See my prior message for details on using this with multiple symbols.

                      I think you're getting a syntax error because some spaces somehow got added into setPriceStudy(true); when you copied the code into your formula editor. Remove those two spaces and you should be good to go.
                      Jason K.
                      Project Manager
                      eSignal - an Interactive Data company

                      EFS KnowledgeBase
                      JavaScript for EFS Video Series
                      EFS Beginner Tutorial Series
                      EFS Glossary
                      Custom EFS Development Policy

                      New User Orientation

                      Comment


                      • #12
                        Jason, re: the fixed y-axis, you don't miss even the smallest details! The extra space was the problem and the study now works great when using on different stock charts. The scaling price increments now stay where I set it. If I hit "auto scale" and the increments change, I just manually reset to my desired increment and it stays there. If desired, I can set every chart to the same price scale increment. COOL!!!

                        Thank your very much as this had been a real nuisance to me.

                        Steve

                        Comment


                        • #13
                          RE: ANOTHER THREAD

                          Jason, you sent me a revised code for smart1 lineattimex(1).efs on another thread and someone else already replied. So I couldn't reply to you from that thread. If there's a way, plz let me know. Anyway, this was about the open price line and changing it to start at 630. It works perfecty! Thanks once again.


                          Steve

                          Comment


                          • #14
                            Hi Steve,

                            Your welcome. As for replying to the other thread, no need to worry about others replying before you. If you address the person you're replying to in the thread it will be understood.
                            Jason K.
                            Project Manager
                            eSignal - an Interactive Data company

                            EFS KnowledgeBase
                            JavaScript for EFS Video Series
                            EFS Beginner Tutorial Series
                            EFS Glossary
                            Custom EFS Development Policy

                            New User Orientation

                            Comment

                            Working...
                            X