Announcement

Collapse
No announcement yet.

Adding R3/S3 and R4/S4

Collapse
X
 
  • Filter
  • Time
  • Show
Clear All
new posts

  • Adding R3/S3 and R4/S4

    How can I add R3/S3 and R4/S4 to the pivots? I am currently using this PivotPointsAll.efs file for my daily pivots:

    /************************************************** **************************************************
    Copyright © eSignal, a division of Interactive Data Corporation. 2003. All rights reserved.
    This sample eSignal Formula Script (EFS) may be modified and saved under a new
    filename; however, eSignal is no longer responsible for the functionality once modified.
    eSignal reserves the right to modify and overwrite this EFS file with each new release.

    @version 2.0
    ************************************************** **************************************************/


    function preMain() {
    setPriceStudy(true);
    setStudyTitle("Pivot Points");
    setCursorLabelName("PP-R2", 0);
    setCursorLabelName("PP-R1", 1);
    setCursorLabelName("PP", 2);
    setCursorLabelName("PP-S1", 3);
    setCursorLabelName("PP-S2", 4);


    // R2
    setDefaultBarStyle(PS_DASH, 0);
    setDefaultBarFgColor(Color.RGB(204,204,0), 0);
    setDefaultBarThickness(1, 0);

    // R1
    setDefaultBarStyle(PS_DASH, 1);
    setDefaultBarFgColor(Color.RGB(0,128,255), 1);
    setDefaultBarThickness(1, 1);

    // Pivot Point
    setDefaultBarStyle(PS_DASH, 2);
    setDefaultBarFgColor(Color.RGB(128,128,128), 2);
    setDefaultBarThickness(1, 2);

    // S1
    setDefaultBarStyle(PS_DASH, 3);
    setDefaultBarFgColor(Color.RGB(0,255,0), 3);
    setDefaultBarThickness(1, 3);

    // S2
    setDefaultBarStyle(PS_DASH, 4);
    setDefaultBarFgColor(Color.RGB(204,204,0), 4);
    setDefaultBarThickness(1, 4);
    }

    // Start of Performance addition
    var vLastRawTime = null;
    var vLastPP = null;
    var vLastPPR1 = null;
    var vLastPPR2 = null;
    var vLastPPS1 = null;
    var vLastPPS2 = null;
    var vLastArray = null;
    var vSymbol = null;
    var vInterval = null;
    var vReset = true;


    function main() {
    var vH;
    var vL;
    var vC;
    var vRawTime;
    var vBarTime;
    var vIndex;

    var nState = getBarState();
    if(vReset == true) {
    vLastRawTime = null;
    vLastArray = null;
    vLastPP = null;
    vLastPPR1 = null;
    vLastPPR2 = null;
    vLastPPS1 = null;
    vLastPPS2 = null;
    vInterval = getInterval();
    vSymbol = getSymbol();
    vSymbol += ",D";
    vReset = false;
    }

    //vRawTime = getValue("rawtime"); // does not work properly with 1 min interval
    vRawTime = getDay();
    if(vRawTime == null)
    return;

    //vRawTime = Math.floor(vRawTime / RawTime.DAY);

    // Start of Performance addition
    if(vRawTime != null && vLastRawTime != null) {
    if(vRawTime == vLastRawTime) {
    return vLastArray;
    // return new Array(vLastPP, vLastPPR1, vLastPPR2, vLastPPS1, vLastPPS2);
    }
    }

    if(vInterval == null)
    return null;

    if(vInterval == "D")
    return null;

    if(vInterval == "W")
    return null;

    if(vInterval == "M")
    return null;

    if(vInterval == "T")
    return null;

    vBarTime = getValue("time");
    if(vBarTime != null) {
    var vDay = vBarTime.getDay();
    if (vDay == 0) {
    var vDate = vBarTime.getDate();
    vDate -= 2;
    vBarTime.setDate(vDate);
    }
    vAbsTime = getPreviousTradingDay(vBarTime, vSymbol);
    if(vAbsTime == null) {
    return;
    }
    vIndex = getFirstBarIndexOfDay(vAbsTime, vSymbol);
    if(vIndex != null) {
    vH = getValueAbsolute("High", vIndex, vSymbol);
    vL = getValueAbsolute("Low", vIndex, vSymbol);
    vC = getValueAbsolute("Close", vIndex, vSymbol);
    if(vH != null && vL != null && vC != null) {
    vLastPP = (vH + vL + vC) / 3;
    vLastPPR1 = 2 * vLastPP - vL;
    vLastPPS1 = 2 * vLastPP - vH;
    vLastPPR2 = (vLastPP - vLastPPS1) + vLastPPR1;
    vLastPPS2 = vLastPP - (vLastPPR1 - vLastPPS1);
    vLastRawTime = vRawTime;
    vLastArray = new Array(vLastPPR2, vLastPPR1, vLastPP, vLastPPS1, vLastPPS2);

    return vLastArray;
    }
    }
    }
    return null;
    }/************************************************** **************************************************

  • #2
    mikem144
    The enclosed revision adds R3/S3 and R4/S4
    Alex

    PHP Code:
    /* 
    Copyright © eSignal, a division of Interactive Data Corporation. 2003. All rights reserved. 
    This sample eSignal Formula Script (EFS) may be modified and saved under a new 
    filename; however, eSignal is no longer responsible for the functionality once modified.
    eSignal reserves the right to modify and overwrite this EFS file with each new release.

    @version 2.0
    */


    function preMain() {
        
    setPriceStudy(true);
        
    setStudyTitle("Pivot Points");
        
    setCursorLabelName("PP-R4"0);
        
    setCursorLabelName("PP-R3"1);
        
    setCursorLabelName("PP-R2"2);
        
    setCursorLabelName("PP-R1"3);
        
    setCursorLabelName("PP"4);
        
    setCursorLabelName("PP-S1"5);
        
    setCursorLabelName("PP-S2"6);
        
    setCursorLabelName("PP-S3"7);
        
    setCursorLabelName("PP-S4"8);

        
    // R42
        
    setDefaultBarStyle(PS_DASH0);
        
    setDefaultBarFgColor(Color.blue0);
        
    setDefaultBarThickness(10);

        
    // R3
        
    setDefaultBarStyle(PS_DASH1);
        
    setDefaultBarFgColor(Color.blue1);
        
    setDefaultBarThickness(11);

        
    // R2
        
    setDefaultBarStyle(PS_DASH2);
        
    setDefaultBarFgColor(Color.RGB(204,204,0), 2);
        
    setDefaultBarThickness(12);

        
    // R1
        
    setDefaultBarStyle(PS_DASH3);
        
    setDefaultBarFgColor(Color.RGB(0,128,255), 3);
        
    setDefaultBarThickness(13); 

        
    // Pivot Point
        
    setDefaultBarStyle(PS_DASH4);
        
    setDefaultBarFgColor(Color.RGB(128,128,128), 4);
        
    setDefaultBarThickness(14);

        
    // S1
        
    setDefaultBarStyle(PS_DASH5);
        
    setDefaultBarFgColor(Color.RGB(0,255,0), 5);
        
    setDefaultBarThickness(15);

        
    // S2
        
    setDefaultBarStyle(PS_DASH6);
        
    setDefaultBarFgColor(Color.RGB(204,204,0), 6);
        
    setDefaultBarThickness(16);

        
    // S3
        
    setDefaultBarStyle(PS_DASH7);
        
    setDefaultBarFgColor(Color.red7);
        
    setDefaultBarThickness(17);

        
    // S4
        
    setDefaultBarStyle(PS_DASH8);
        
    setDefaultBarFgColor(Color.red8);
        
    setDefaultBarThickness(18);
    }

    // Start of Performance addition
    var vLastRawTime null;
    var 
    vLastPP null;
    var 
    vLastPPR1 null;
    var 
    vLastPPR2 null;
    var 
    vLastPPR3 null;
    var 
    vLastPPR4 null;
    var 
    vLastPPS1 null;
    var 
    vLastPPS2 null;
    var 
    vLastPPS3 null;
    var 
    vLastPPS4 null;
    var 
    vLastArray null;
    var 
    vSymbol null;
    var 
    vInterval null;
    var 
    vReset true;


    function 
    main() {
    var 
    vH;
    var 
    vL;
    var 
    vC;
    var 
    vRawTime;
    var 
    vBarTime;
    var 
    vIndex;

    var 
    nState getBarState();

        if(
    vReset == true) {
            
    vLastRawTime null;
            
    vLastArray null;
            
    vLastPP null;
            
    vLastPPR1 null;
            
    vLastPPR2 null;
            
    vLastPPR3 null;
            
    vLastPPR4 null;
            
    vLastPPS1 null;
            
    vLastPPS2 null;
            
    vLastPPS3 null;
            
    vLastPPS4 null;
            
    vInterval getInterval();
            
    vSymbol getSymbol();
            
    vSymbol += ",D";
            
    vReset false;
        }

        
    //vRawTime = getValue("rawtime"); // does not work properly with 1 min interval
        
    vRawTime getDay(0);
        if(
    vRawTime == null)
            return;

        
    //vRawTime = Math.floor(vRawTime / RawTime.DAY);

        // Start of Performance addition
        
    if(vRawTime != null && vLastRawTime != null) {
            if(
    vRawTime == vLastRawTime) {
                return 
    vLastArray;
        
    // return new Array(vLastPP, vLastPPR1, vLastPPR2, vLastPPS1, vLastPPS2);
            
    }
        }

        if(
    vInterval == null)
            return 
    null;

        if(
    vInterval == "D")
            return 
    null;

        if(
    vInterval == "W")
            return 
    null;

        if(
    vInterval == "M")
            return 
    null;

        if(
    vInterval == "T")
            return 
    null;

        
    vBarTime getValue("time");
        if(
    vBarTime != null) {
            var 
    vDay vBarTime.getDay();
            if (
    vDay == 0) {
                var 
    vDate vBarTime.getDate();
                
    vDate -= 2;
                
    vBarTime.setDate(vDate);
            }
            
    vAbsTime getPreviousTradingDay(vBarTimevSymbol);
            if(
    vAbsTime == null) {
                return;
            }
            
    vIndex getFirstBarIndexOfDay(vAbsTimevSymbol);
            if(
    vIndex != null) {
                
    vH getValueAbsolute("High"vIndexvSymbol);
                
    vL getValueAbsolute("Low"vIndexvSymbol);
                
    vC getValueAbsolute("Close"vIndexvSymbol);
                if(
    vH != null && vL != null && vC != null) {
                    
    vLastPP = (vH vL vC) / 3;
                    
    vLastPPR1 vLastPP vL;
                    
    vLastPPS1 vLastPP vH;
                    
    vLastPPR2 = (vLastPP vLastPPS1) + vLastPPR1;
                    
    vLastPPS2 vLastPP - (vLastPPR1 vLastPPS1);
                    
    vLastPPR3 vLastPP vLastPPR2 vLastPPS1;
                    
    vLastPPS3 vLastPP vLastPPR2 vLastPPS1;
                    
    vLastPPR4 vLastPP vLastPPR3 vLastPPS1;
                    
    vLastPPS4 vLastPP vLastPPR3 vLastPPS1;
                    
    vLastRawTime vRawTime;
                    
    vLastArray = new Array(vLastPPR4,vLastPPR3,vLastPPR2vLastPPR1vLastPPvLastPPS1vLastPPS2,vLastPPS3,vLastPPS4);

        return 
    vLastArray;
                }
            } 
        }
        return 
    null;

    Comment


    • #3
      Thanks, Alex. Your prompt replies are really great!! One more question about pivots. They are calculated based on the prior day's candle, I know. What time does this candle end? Is it the end of the Globex session (16.00h Chicago time) or at midnight? Right now, we are in the overnight Globex session, beginning 17.00h Chicago time, but the pivots still show the values for yesterday's session. Please advise. TIA

      Comment


      • #4
        mikem144
        Up until the time the servers are reset - which happens at midnight - the new trading session (Globex, Access, etc) continues tracking on the current day's bar therefore the pivots will still be those for yesterday's session. Once the reset occurs the new trading session gets moved on to the new daily bar. The pivots at that point adjust accordingly as they are based on daily data.
        Alex

        Comment


        • #5
          So the question is, what time does the daily candle use as the close? It seems that the candle uses a 24 h clock, and so the closing price is the price right before midnight. Since the globex session (for Euro FX) runs from 17.00 Chicago time to 16.00 Chicago time, eSignal's Hi/Lo/Close will not be the same as CME's and the pivots will not be accurate. For example, based on yesterday's actual Hi/Lo/Close for Euro FX, the pivots should be PP 13311, R1 13352, R2 13391; but eSignal calculates them as PP 13303, R1 13347, R2 13353, etc.

          So, how can this be changed to reflect the correct values?

          TIA

          Comment


          • #6
            mikem144

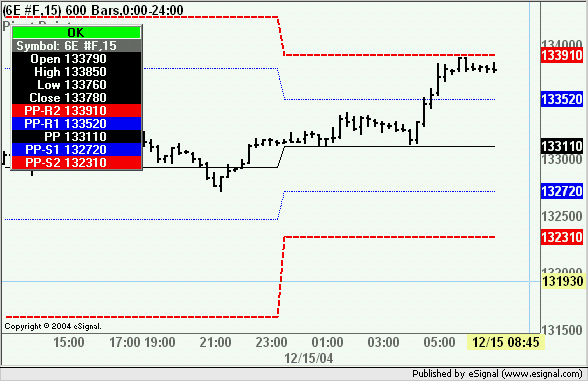
            For example, based on yesterday's actual Hi/Lo/Close for Euro FX, the pivots should be PP 13311, R1 13352, R2 13391;

            Those are the values I am showing with the Pivot Point study (see image below)
            The daily bar/candle (which the Pivot study references to compute the values) reflects the trading hours of the symbol therefore 17:00-16:00 CT. However at 17:00 the new session will still track on the current daily bar up until the reset time (ie midnight). At that time the new session gets moved on to the new daily bar
            Alex

            Comment


            • #7
              Alex,

              What are you using as a time template for that chart?

              Comment


              • #8
                mikem144
                That is a 24 hour time template (you can see the settings in the study title along with the symbol)
                Alex

                Comment


                • #9
                  I thought so....Strange, my chart shows totally diffent values. Here's a snap of it.
                  Attached Files

                  Comment


                  • #10
                    Any suggestions, Alex? TIA

                    Comment


                    • #11
                      Alex,

                      I just reloaded my 6e #f chart, and the prices changed on the daily chart, and now the pivots are correct. What happened here? You didn't say something to somebody, did you? LOL

                      Comment


                      • #12
                        mikem144
                        Not a word. Glad to hear that it is running correctly now
                        Alex

                        Comment


                        • #13
                          Weekly pivots

                          Alex,

                          As long as we're on the subject, it seems there is a problem calculating the weekly pivots. Using the Arps weekly pivot tool on the daily chart, I get PP 13291, R1 13434, S1 13103. (Included snap.) This is correct.

                          When plotted on the 3minute chart, however, I get different values. I'll also send a snap of the chart.

                          Please advise. TIA!!
                          Attached Files

                          Comment


                          • #14
                            Here is the snap of the weekly pivots plotted on the 3m chart.
                            Attached Files

                            Comment


                            • #15
                              mikem144
                              I would suggest that you redirect the question to Arps' developers.
                              Alex

                              Comment

                              Working...
                              X